
Measuring and Reducing the Reject Rate
Reject Rate in Manufacturing
By reducing the reject rate, a company’s economic performance can be significantly improved. We discuss the most common causes of waste in production and present measures to prevent rejects.
Introduction
What are rejects?
The term rejects refers to manufactured products that do not meet the minimum quality requirements. As a result, they cannot be sold or used and must either be disposed of or reworked. Terms with similar meaning are scrap, usually referring to leftover materials that need to be reworked or recycled, and waste, a broader term including defects as well as excess product.
Rejects are among the most costly losses for manufacturing companies, as these unusable products consume materials and other resources without generating any revenue. Therefore, companies strive to measure and minimize rejects as much as possible.
In manufacturing, the reject rate is a commonly used metric to measure rejects. The reject rate (also called scrap rate) shows the share of defective, unusable products in the total quantity produced, as a percentage.
The following sections provide an overview of the causes of rejects, methods for accurately capturing reject data, and measures to reduce reject rates.
Formula and Example
How to Calculate the Reject Rate: Formula and Example

The reject rate is calculated by dividing the number of rejects by the total quantity produced and multiplying by 100.
Reject rate (%) = Rejects ÷ Total quantity × 100
The total quantity includes good parts and rejected parts from the same period, the same line or the same order.
Example
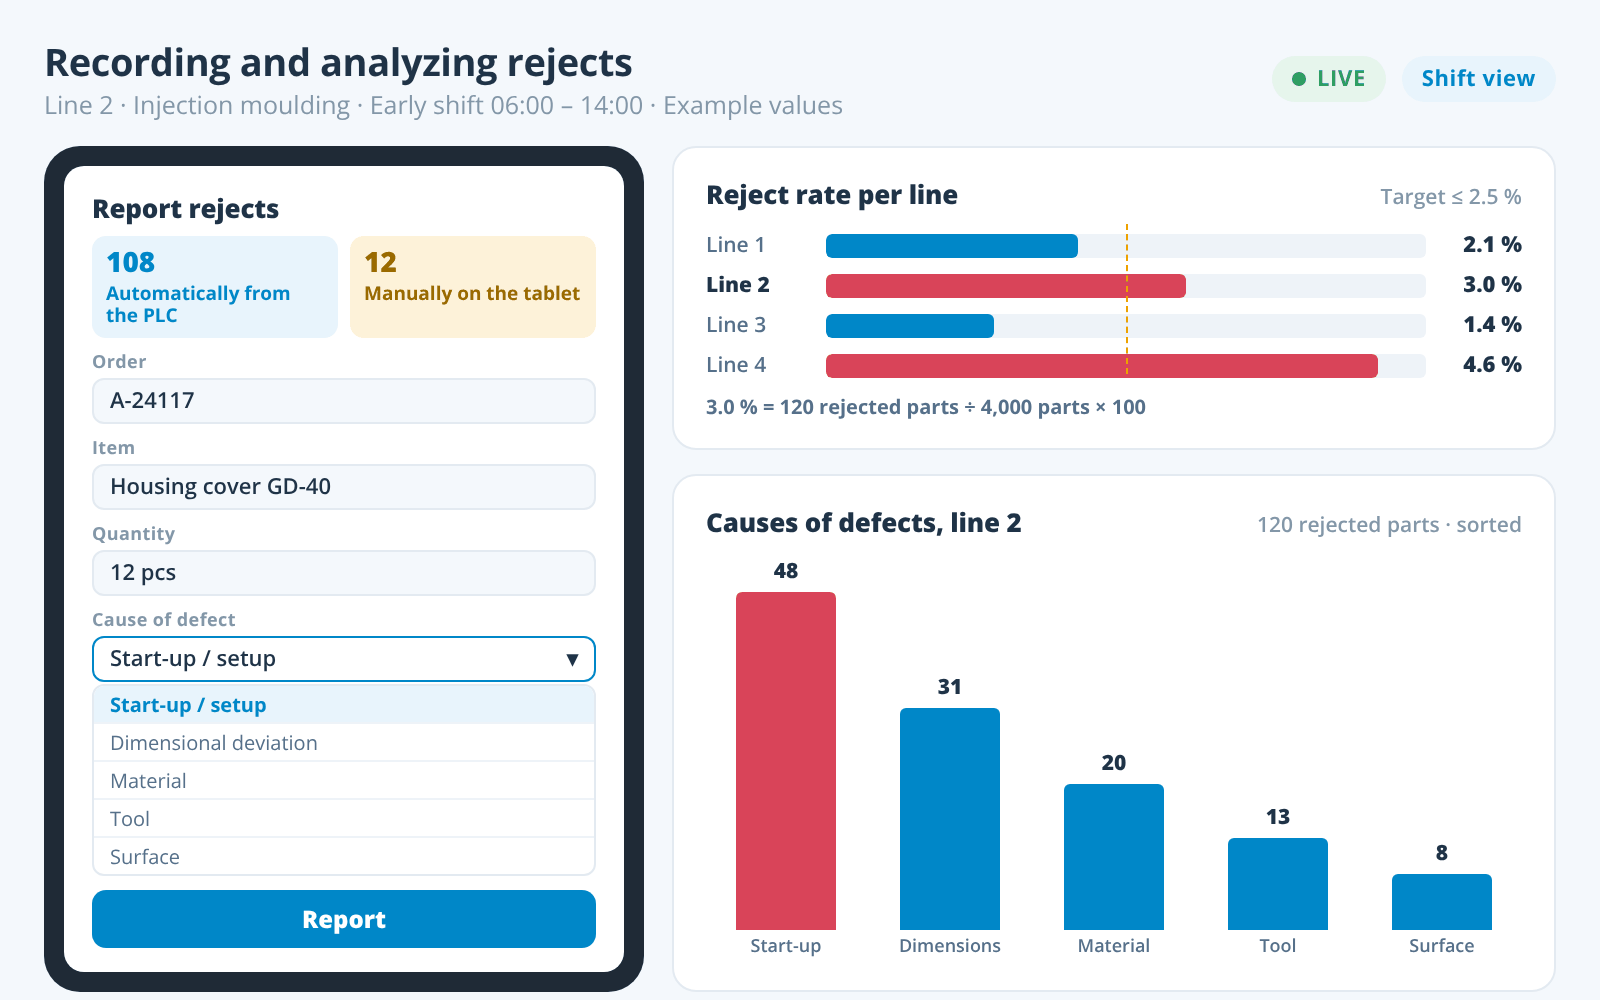
An injection moulding machine produces 4,000 parts in one shift. 120 of them are defective and are sorted out.
- 4,000 parts produced
- 120 rejected parts
- 3 % reject rate
120 ÷ 4,000 × 100 = 3 %. The yield of good parts is therefore 97 %.
To keep the KPI comparable, companies should define four things:
Unit of reference
Rework
Start-up scrap
Period and location
Relationship with OEE
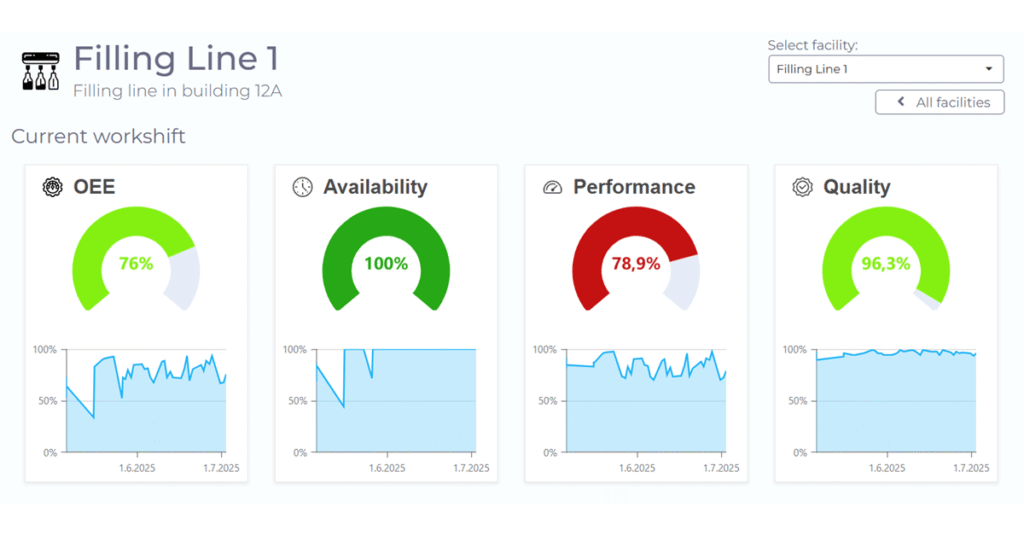
The reject rate is closely linked to the quality factor of OEE. The quality factor only counts parts as good if they are right the first time – neither sorted out nor reworked.
This means: Quality factor = 100 % − reject rate − rework rate.
Costs
Scrap Costs: What Rejects Really Cost
Scrap costs are all costs caused by defective, unusable products. They include:
- Material of the rejected parts,
- Machine and labour time of all processing steps until the defect is detected,
- Disposal or recycling of the scrap,
- Follow-up costs such as extra shifts, reproduction or late delivery.
In simplified terms, the direct scrap costs can be calculated as follows:
Scrap costs = Number of rejects × Manufacturing costs per part + Disposal costs − Recycling revenue
The manufacturing costs per part cover all processing steps up to defect detection. Follow-up costs such as extra shifts come on top, but can only be quantified case by case.
Example (Continued)
The injection moulding machine from the calculation example above produces 120 rejected parts per shift. By the time of final inspection, each part has incurred €2.50 in manufacturing costs. Disposal and recycling are ignored here.
- 120 rejects per shift
- €2.50 manufacturing costs per part
- €300 per shift
- €132,000 per year
120 × €2.50 = €300 per shift. With two shifts on 220 working days, that is €132,000 per year. The figures are a calculation example, not industry values.
The later a defect is detected, the more expensive the rejected part, because every processing step adds more value to it. Early quality control directly at the machine therefore lowers not only the reject rate but above all manufacturing costs.
Distinction
Scrap vs Rework: What Is the Difference?
Scrap is sorted out, rework is repaired. Both are quality losses but are recorded separately.
| Criterion | Rework | Scrap |
|---|---|---|
| Condition of the part | defective but repairable | defective and unusable |
| What happens to it | is reworked and then sold | is disposed of, recycled or sold as scrap |
| Costs | additional labour time, inspection, lead time | material and all added value up to defect detection |
| KPI | rework rate | reject rate |
| OEE quality factor | counts as a loss (not a good part first time) | counts as a loss |
| Typical example | paint defect is polished out | sheet with dimensional deviation is scrapped |
Together, both values give the share of parts that are not right the first time (counterpart: Right First Time).
Causes
Causes of rejects
To effectively reduce production rejects, they should be measured as precisely as possible and categorized based on predefined criteria and causes. A solid data foundation is essential for identifying and eliminating the specific sources of defects.
Example: Tool wear can lead to rejects, just like low-quality materials. When data on material and tool usage is linked to reject data, companies can identify which tools or materials contribute to higher reject rates. As a result, they can replace unsuitable tools or switch to higher-quality materials.
Categorization of rejects based on causes
Possible causes of rejects vary depending on the type of production.
One of the most common reasons for rejects is quality fluctuations that occur during machine setup and startup. Rejects linked to machine setup / startup often result from unstable process conditions or target values that have not yet been reached. Optimizing setup and startup processes is therefore one of the most common starting points for reducing the reject rate.
Below are additional key sources of rejects along with relevant examples.

Manual input errors / User-related errors
- Manual input errors, incorrect machine settings
- Wrong tool selection
- Wrong material selection
- Communication errors

Suboptimal maintenance times and processes
- Delayed maintenance
- Undetected wear or defects
- Insufficiently trained maintenance staff
- Use of inappropriate spare parts

Material and tool quality
- Low-quality materials (e.g. sheets with thickness tolerance deviations, paint with excessive viscosity)
- Incorrect labelling / mix-ups
- Hidden tool damage (e.g. microcracks, dull cutting edges)

Process instabilities
- Fluctuating process parameters (e.g. variations in temperature, pressure)
- Insufficient synchronization between consecutive process steps
- Process sensitivity to external influences (e.g. ambient temperature, humidity affecting process stability)
- Inadequate process control with changing batches or products

External conditions
- Fluctuating temperatures, temperature differences between production and storage areas
- High humidity
- Dust or contaminants
- Electrostatic charges

Design and planning errors
- Incomplete specifications for production
- Inadequate consideration of material properties during design
- Missing or unclear tolerance definitions in drawings or CAD models
- Insufficient coordination between design, manufacturing and quality assurance
Data Collection
Recording and analysis of reject data
In the previous section, we described some of the most common reasons for rejects in production. The key to minimizing the reject rate lies in collecting and analyzing relevant data.
This data can come from machine controls, quality inspections, sensors, production planning or manual entries. Environmental conditions such as temperature and humidity can also provide clues to potential sources of error, as can data on maintenance and downtimes.
This data is needed to:
- Identify areas with unusually high reject rates,
- Calculate the economic impact of scrap and determine whether countermeasures are worthwhile,
- Identify the exact causes of rejects,
- Assess the success of optimization measures,
- Continuously monitor production and respond quickly to rising reject rates.
Requirements to collect reject data
To collect and analyse reject data systematically, three requirements must be met:
Clear Definition of Rejects
- What counts as a reject for this product?
- Are there different levels, e.g. rework or disposal?
- Which categories are used, e.g. source of error or type of defect?
Inspection Processes and Data Sources
- Where and when are rejects detected? Often at several points in the process.
- How is the data collected, e.g. via PLCs, image recognition or manual entry?
- Where must data from several inspections be consolidated?
Technical Infrastructure
- Can data from all relevant sources reach the company’s IT systems?
- Which interfaces are needed? Standards reduce cost and effort.
- At which points can data collection be automated?
Requirement for the Software
A software solution for collecting reject data should offer interfaces both to the various data sources and to other IT systems.
Methods for measuring reject data
Reject data can be collected at various points in the production process – from entries by employees to automatic reports from the machine.
Manual Data Input
Employees inspect parts at testing stations or during final inspection and report defects via an input terminal or mobile app.
- Testing station
- Final inspection
- Input terminal
- Mobile app
Semi-Automated Collection
The system supports operators: It suggests defect causes to choose from or assigns component, batch and workstation automatically via a scan.
- Dropdown menus
- Barcode scan
- RFID
Automated Collection
Machines, sensors and measuring systems report defective parts themselves, e.g. in case of pressure deviations, dimensional excess or surface defects.
- Machine signals
- Cameras and image processing
- Laser scanners
- Inline measurement
manubes
Collecting and Analysing Reject Data
with manubes
With manubes, you manage reject data on one central platform. Collect data automatically from controllers, databases, ERP and QM systems, or provide mobile interfaces for manual entries. Visualise rejects in dashboards and reports, send push notifications when reject rates are high and analyse data with the help of AI.
-
Connect Reject Sources
Machine signals, inspection systems and QM and ERP data arrive automatically – securely from every plant via edge components.
System integration -
Store Rejects in a Structured Way
Quantity, cause of defect, order, line and shift are kept in your own data model – comparable across all sites.
Datamodel Designer -
Keep the Reject Rate in View
Dashboards show the current and historical reject rate per line and the most frequent causes of defects.
Dashboards -
Link Maintenance and Rejects
Documented maintenance shows whether tool wear or downtimes are related to rising rejects.
-
Prevent Defects at the Source
Mobile work instructions ensure that set-up, start-up and inspection run the same way every time.
Work instructions -
Find Causes Faster
The AI assistant answers questions such as “Which line had the most rejects this week?” from the existing data.
AI assistant
Measures to reduce the reject rate
The most effective measures against rejects address the most common causes: Manual inputs, mix-ups of materials and tools, maintenance and unstable start-up processes.
Automated data transfers
Instead of manually entering data such as machine settings and article numbers, companies can automatically transmit this information from IT systems (e.g. MES) to machine controls.
Replacing manual inputs with automated data transfers not only eliminates human error during data entry but also saves time through automation while reducing the need for extensive training.
Material and tool verification via scan
By using material or tool scans, a verification step can be integrated that requires minimal time and prevents costly mix-ups.
Production staff can scan QR codes or barcodes on packaging materials to confirm that the correct material is being used for the current order. Similarly, tools can be checked for approval and suitability.
Digital work instructions with integrated checks
Digital work instructions can provide step-by-step guidance through a process. Integrated inspections (e.g. checkboxes, photos, input fields for inspection values) ensure that critical steps are properly checked.
Digital work instructions minimize the risk of misinterpretation and support the standardization of procedures, resulting in more consistent product quality.
Documentation of maintenance processes
Comprehensive maintenance documentation helps identify maintenance needs, determine optimal maintenance intervals, and address recurring issues that could lead to scrap at an early stage.
Maintenance activities are recorded systematically and digitally – including timestamps, actions taken, personnel involved, and digital checklists. This data is available for analysis and can be linked to reject data.
Determining ideal setup/startup parameters
Through systematic trials or data analysis, optimal settings for production start-up can be identified and documented (e.g. temperature profiles, feed rates, ramp-up curves).
These settings can help reduce start-up scrap, thereby addressing one of the most significant categories of rejects in production.
Utilizing a central data platform
Consolidating and structuring production data on a central data platform creates a company-wide data foundation and a single point of access for both current and historical data. Companies can assign user permissions and set up interfaces to other systems.
This facilitates communication and collaboration between different teams and reduces the risk of planning errors.
Conclusion
Reject rate – an important KPI for manufacturers
Minimizing scrap is one of the most common approaches to production optimization. Improvements in various areas can reduce the number of defective products and thus lower the reject rate.
To achieve this, data is collected that provides insights into the causes of product defects and potential countermeasures.
With manubes, we offer a specialized platform for digital production management. Users are able to collect, structure and store various data in a central location. No-code design tools allow for the development of custom solutions for every production environment.
Product video: Get to know manubes
Frequently asked questions about the reject rate
How do you calculate the reject rate?
The reject rate is the number of rejects divided by the total quantity produced, multiplied by 100. Example: 120 defective parts out of 4,000 give a reject rate of 3 %.
What is a good reject rate?
There is no universal target value for the reject rate, because it depends heavily on the industry, product and process. What matters is the comparison with your own baseline per line and product and the trend over time.
What is the difference between scrap and rework?
Scrap cannot be used and is sorted out, rework is repaired and then sold. Both are recorded separately: As the reject (scrap) rate and as the rework rate.
What do scrap costs include?
Scrap costs include material, machine and labour time up to defect detection, disposal and follow-up costs such as reproduction. The later a defect is detected, the higher the cost per rejected part.
What are the most common causes of rejects?
The most common causes of rejects include quality fluctuations during machine setup and start-up (start-up scrap), manual input errors, material and tool defects, maintenance deficits and unstable process parameters.
How are reject rate and OEE related?
Rejects lower the quality factor of OEE, because only defect-free parts count as good parts. Without rework: Quality factor = 100 % − reject rate.
How can rejects be recorded automatically?
Modern machines report defective parts via their controllers, while cameras and inline measurement systems detect deviations during the process. manubes reads such signals via standard interfaces such as OPC UA and MQTT and adds manual inputs from mobile devices.
Further information

Try manubes for free
Test the different manubes features in your personal cloud environment.
Get started
