
No-code energy monitoring for production
Energy monitoring
Capture, visualise and reduce energy consumption – without programming and without server infrastructure of your own. As an addition to an existing energy management system, or as a straightforward way to get started.
Definition
What is energy monitoring?
Energy monitoring is the continuous, automated capture and analysis of energy consumption – in production typically per machine, line or utility (electricity, gas, compressed air, water). Readings are taken at short intervals, so the values exist as a time series instead of only becoming visible with the annual bill.
How it differs from energy management: monitoring provides the data. An energy management system (EnMS) to ISO 50001 is the organisational framework on top of it – objectives, responsibilities, measures, audits. Energy data management (EDM) refers to capturing, storing and preparing the measured data itself. In practice: monitoring without an EnMS is perfectly possible, an EnMS without monitoring is barely workable.
The central metric is specific energy consumption – the energy used per unit produced, for example kWh per piece, tonne or batch. In ISO 50001 such a measure is called an energy performance indicator (EnPI). It makes consumption comparable across different levels of capacity utilisation, which absolute consumption cannot do.
The regulatory position in Germany: under the Energy Efficiency Act (EnEfG), companies with more than 7.5 GWh of total final energy consumption on annual average must operate an energy or environmental management system; from 2.5 GWh upwards, implementation plans for economically viable savings measures must be published (section 9 EnEfG). On top of this come energy audits to DIN EN 16247-1 for non-SMEs and reporting obligations arising from the CSRD. Deadlines and evidence requirements are summarised by the BAFA (in German).
Why Now?
Energy has gone from a fixed cost to something you steer
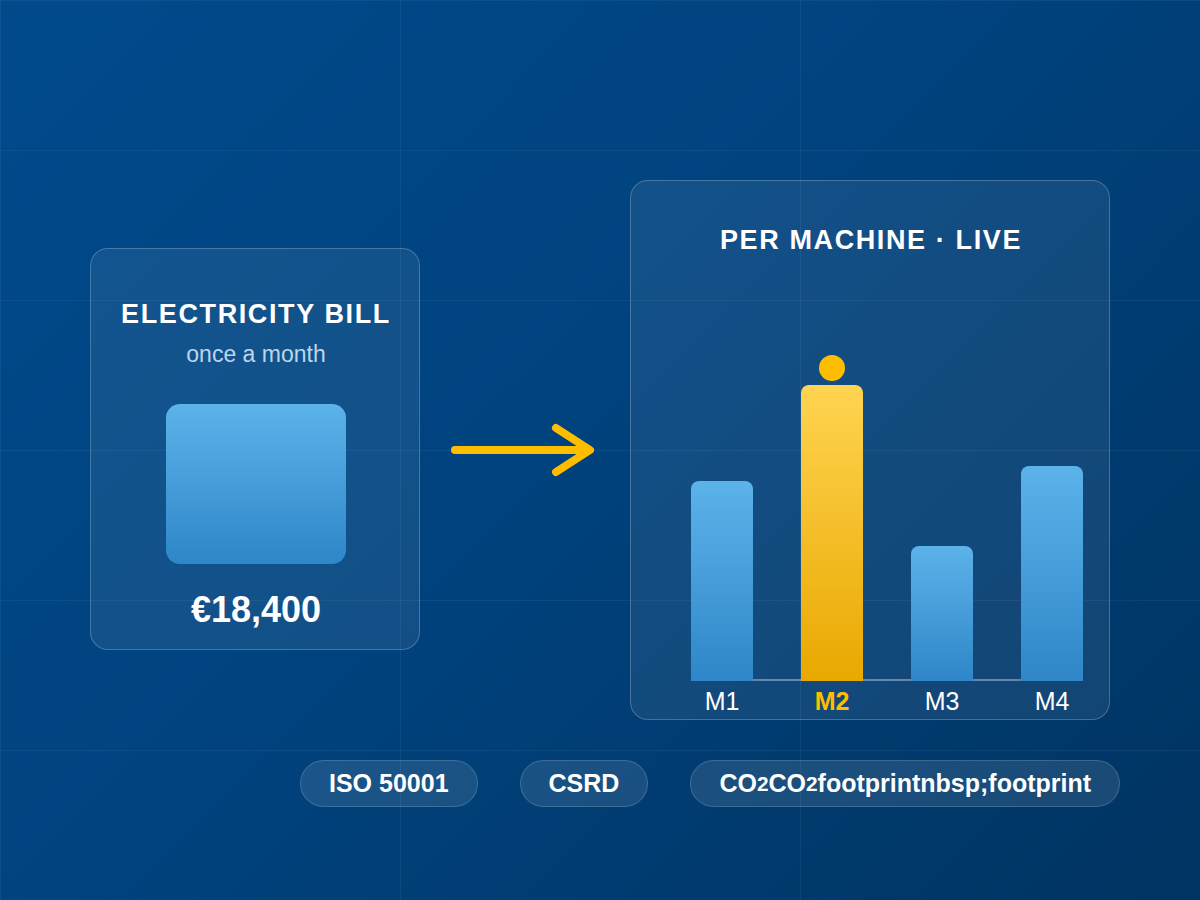
Higher energy prices, ISO 50001, CSRD reporting obligations and customers asking about the carbon footprint: hardly any manufacturer can still afford not to know its energy consumption. The monthly electricity bill is not enough for that – it shows neither which machine consumes how much, nor when and why.
Only continuous measurement at machine and line level makes savings visible: base load outside production hours, load peaks, inefficient equipment or compressed air leaks. Energy becomes a production metric like any other – taking its place alongside OEE, cycle time and scrap – one of the key metrics in production. Once you know it, you can reduce production costs deliberately instead of cutting across the board.
Energy data straight from meters and machines
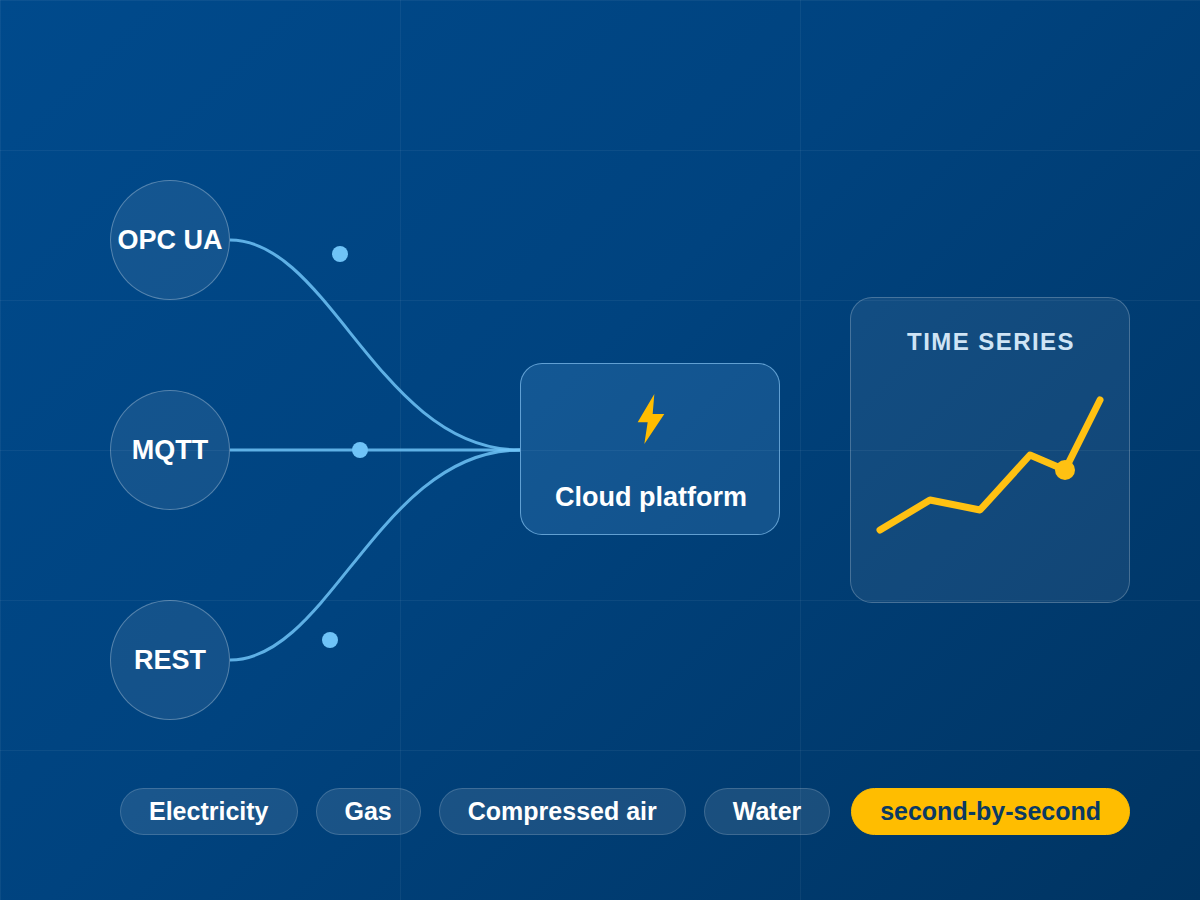
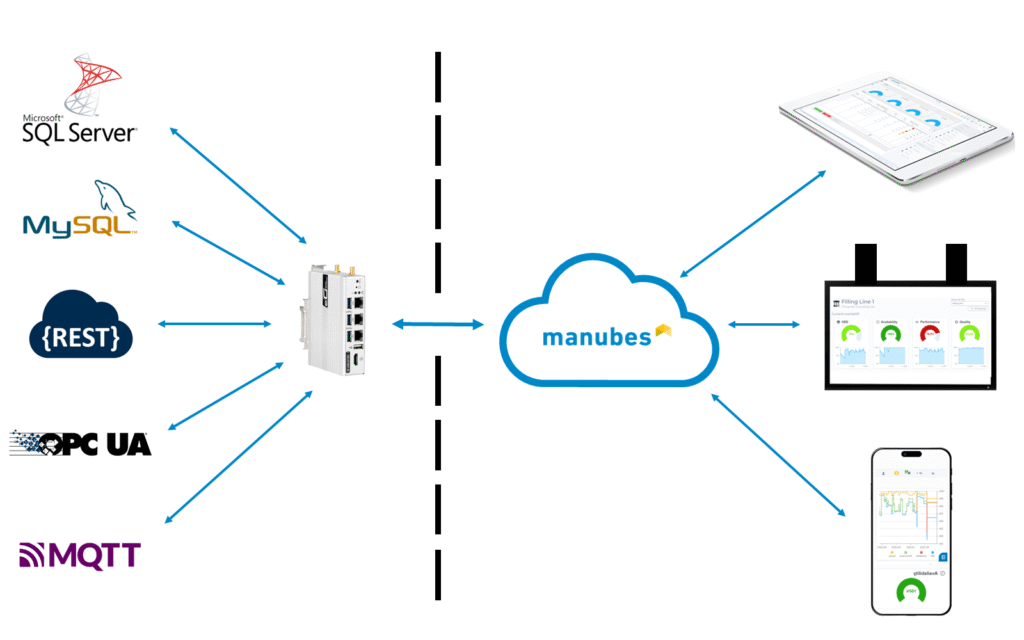
manubes connects via OPC UA, MQTT or REST to energy meters, controllers and existing systems – measuring equipment you already have can stay in place. Consumption values (electricity, gas, compressed air, water) arrive in the platform automatically as time series, to the second and without anyone reading a meter by hand.
Meters with no network connection of their own are picked up by an edge device; the same mechanism that machine data capture uses throughout.
Dashboards by drag & drop – without a line of code
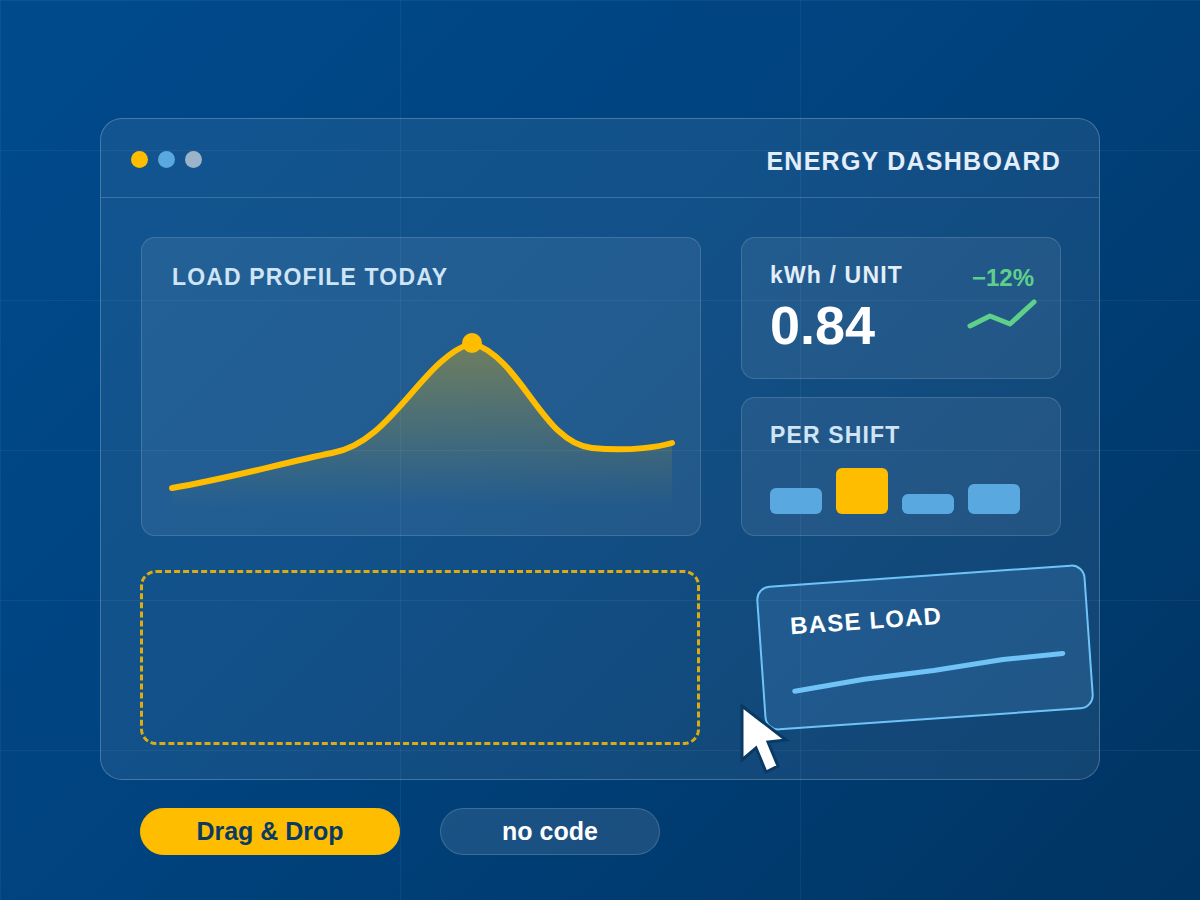
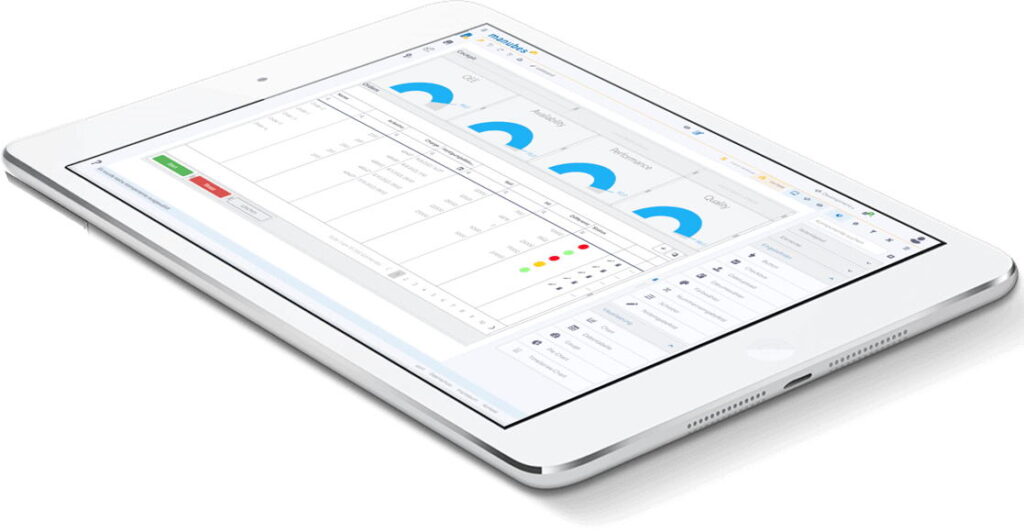
Load profiles, consumption per shift, cost per cost centre or kWh per unit produced: dashboards are built in manubes by drag & drop – that is exactly what the no-code approach means. No development project, no requirements document, no waiting: the department builds its own energy views and adjusts them whenever it likes – the energy monitoring software takes shape where the questions arise.
That applies to energy just as it does to every other production dashboard – right through to shopfloor boards for the screen on the factory floor.
In Practice
What goes on an energy dashboard: time series chart and KPI cards
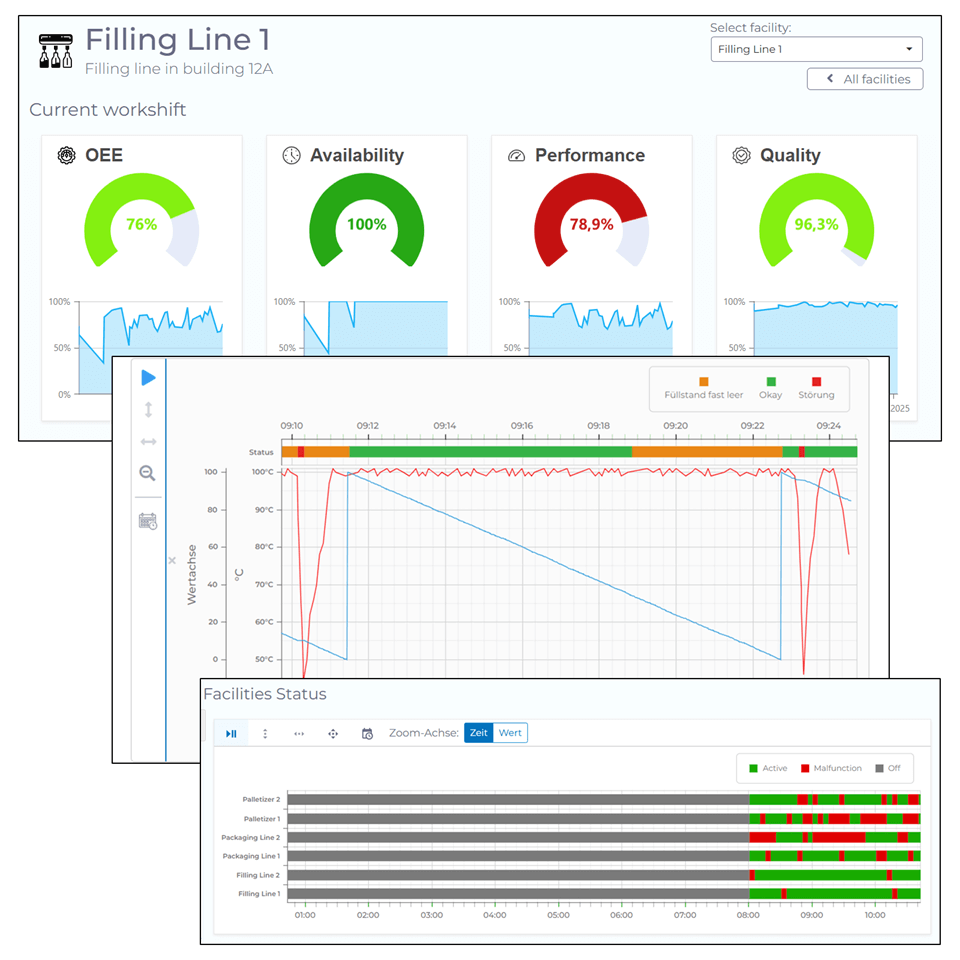
An energy dashboard in manubes is made up of a few recurring building blocks. Two of them carry most of the message: the time series chart for how things develop over time, and the KPI card for the one number that matters right now.
Time series chart – the load profile. Power draw in kW across the day, several curves on top of each other: press, compressor, main connection. Only this view shows what no monthly bill can – the load peak when everything starts up in the morning, the base load that never drops to zero at night or at the weekend, or the compressor that keeps running between shifts. Put the production schedule next to it and the curve turns into an explanation.
KPI cards – the number for the shift. Consumption of the current shift in kWh, energy cost since the start of the month in euros, specific energy consumption in kWh per unit produced, or the current peak load against the agreed maximum. As a tile with a colour indicator it is immediately clear whether the value is where it should be – nobody has to read a table for that.
Alongside these come gauge charts for values with a fixed target range, such as compressed air pressure, and tables for comparing lines, sites or cost centres. Every element is placed in the Page Designer and connected to the time series through a guided configuration – the same mechanics as visualising OPC UA data or building an OEE visualisation.
Load profile over 24 hours
kWh per unit produced
Peak load against the limit
From metric to action
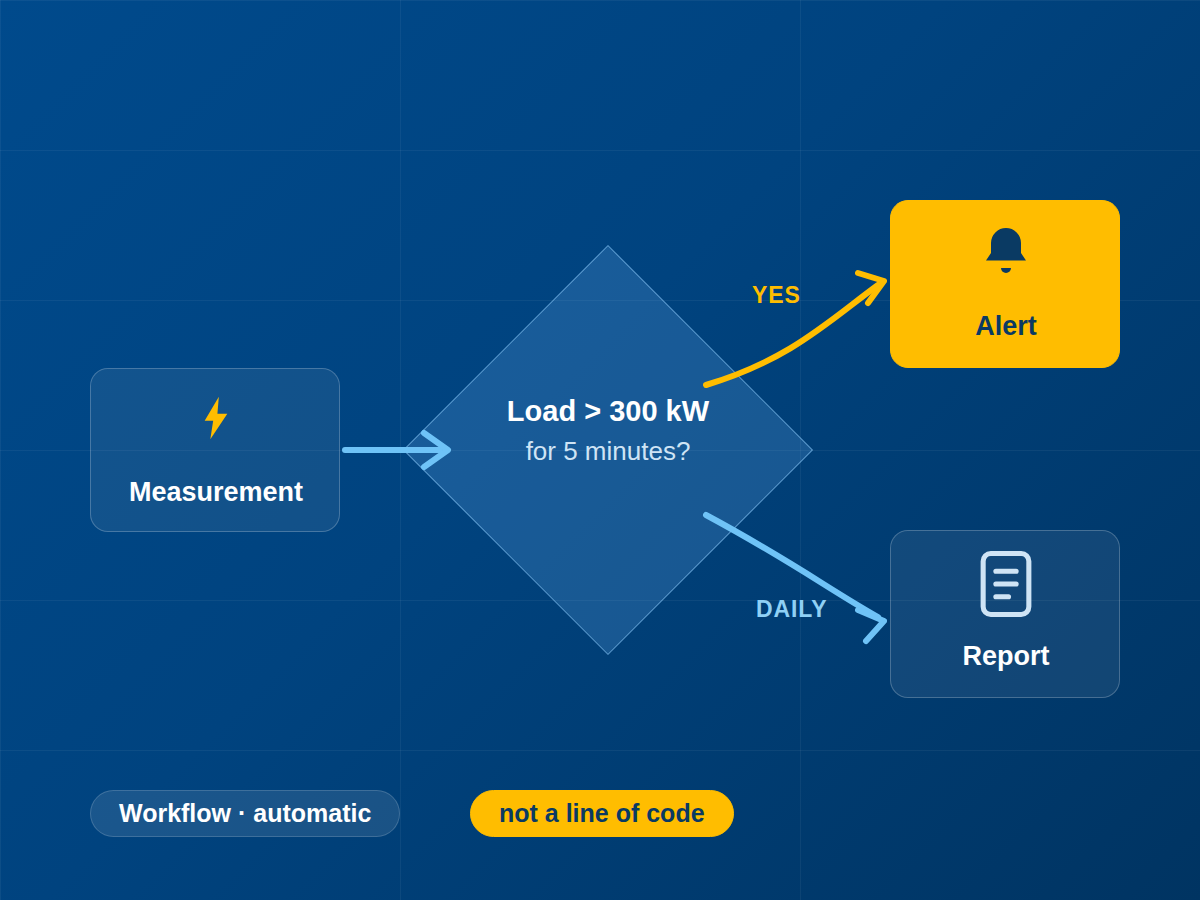
Workflows in manubes react to the data automatically: alerts on load peaks as the basis for load management and peak shaving, a notification when the base load is unusual at the weekend, automatic reports for the energy team or the auditor. That turns pure monitoring into an active improvement process – the foundation of any energy management.
The message reaches the team as a mobile notification, the monthly report is produced as automated production reporting – both part of workflow automation in production.
Alongside an EnMS – or the First Step
No-code energy monitoring: alongside an EnMS – or the way in
A certified energy management system to ISO 50001 answers the “what” and the “why” – the continuous data behind it comes from monitoring. With a no-code platform such as manubes, companies add real-time data from machine level to their existing EnMS, with no IT project and no additional infrastructure – the platform runs in the cloud rather than on premise.
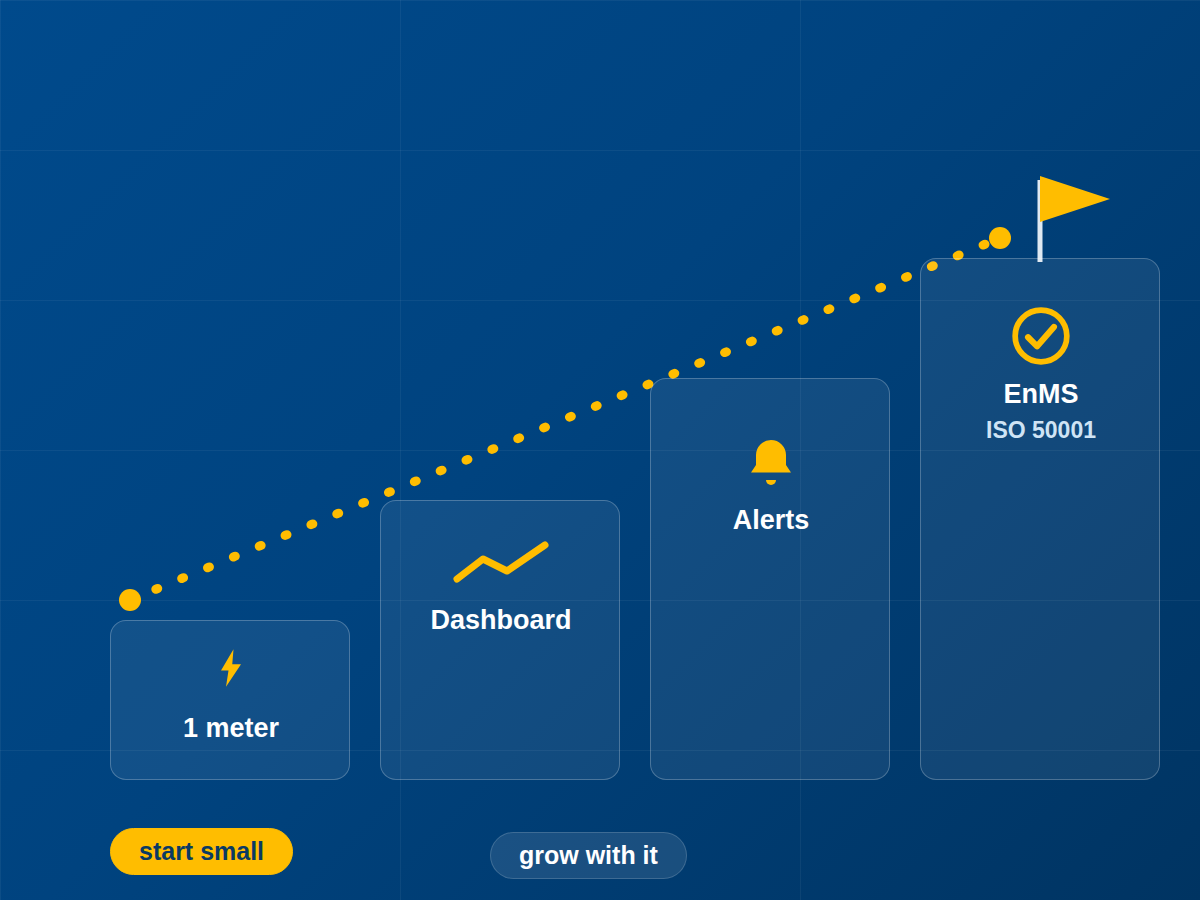
For smaller operations without an EnMS, the point is this: you do not have to start with certification. The pragmatic first step is to measure at all – a handful of meters, one dashboard and one alert rule. As the ambition grows, the solution grows with it; the data collected along the way is later the basis for audit and certification – and, incidentally, for continuous improvement.
Measure first, manage second: a no-code start delivers in days the transparency that conventional projects need months for.
Without programming
No infrastructure of your own
Fits your energy management
Start small, grow with it
Frequently asked questions about energy monitoring
The questions manufacturers ask us most often when they start out with energy monitoring.
What is the difference between energy monitoring and energy management?
Energy monitoring is the measuring: consumption values are captured, stored and analysed continuously. Energy management is the organisational framework on top of it – objectives, responsibilities, measures and their review, in certified form as an energy management system (EnMS) to ISO 50001.
You can measure without running an EnMS. An EnMS without reliable measured data, on the other hand, is hardly workable: without numbers you can neither set a target nor demonstrate that a measure worked.
What data do you need for energy monitoring?
As a minimum: consumption values per measuring point with a timestamp – electricity in kWh and power in kW, plus gas, compressed air, heat and water where relevant. The shorter the measuring interval, the sooner load peaks and base load become visible; 15 minutes is usual for load profiles, while machine level warrants considerably shorter intervals.
The values only become truly meaningful in context: unit counts, shift calendars or order data turn absolute consumption into specific consumption per unit – the metric that stays comparable across different levels of capacity utilisation.
Do you need new meters for energy monitoring?
Often not. Many plants already have meters installed whose values have simply never been read out. If the existing equipment provides its data over a standard interface such as OPC UA, MQTT or Modbus, it can stay in place; where there is no network connection, an edge device handles it.
New meters are needed where nothing is being measured at all so far – typically when individual large consumers such as compressors, furnaces or presses are to be looked at separately.
Is energy monitoring mandatory for ISO 50001?
The standard does not prescribe any particular software. It does require that energy performance is monitored, measured, analysed and evaluated – and that it is defined which data is collected for this and how. In practice that leads to continuous measurement, which is precisely what energy monitoring delivers.
Independently of certification, the Energy Efficiency Act applies in Germany: above a total final energy consumption of 7.5 GWh on annual average an energy or environmental management system is mandatory, and from 2.5 GWh upwards implementation plans must be published.
What is a load profile?
The load profile is how electrical power draw develops over time, usually in 15-minute values across a day, a week or a year. It shows when how much power is drawn – in contrast to consumption, which only gives the total over a period.
The load profile reveals the two most common savings opportunities: load peaks, which become expensive in grid charges, and the base load outside production hours, which shows what keeps running unnoticed at night and at the weekend.
How large does an operation have to be for energy monitoring to pay off?
There is no lower limit below which measuring stops making sense – what matters is whether energy use is significant enough to justify measures. A single large consumer such as a compressed air station can be enough to carry the effort.
The difference lies more in the route taken: large plants are under a legal obligation anyway and usually start from the EnMS. Smaller operations begin pragmatically – a handful of meters, one dashboard and one alert rule – and expand once the benefit is proven. A cloud-based no-code tool makes that entry possible without it turning into an IT project.
Further information
Try manubes – free and without obligation
Make your energy consumption visible – connect your first meter and build your energy dashboard today. No programming, no servers, no risk.
Try manubes for free
