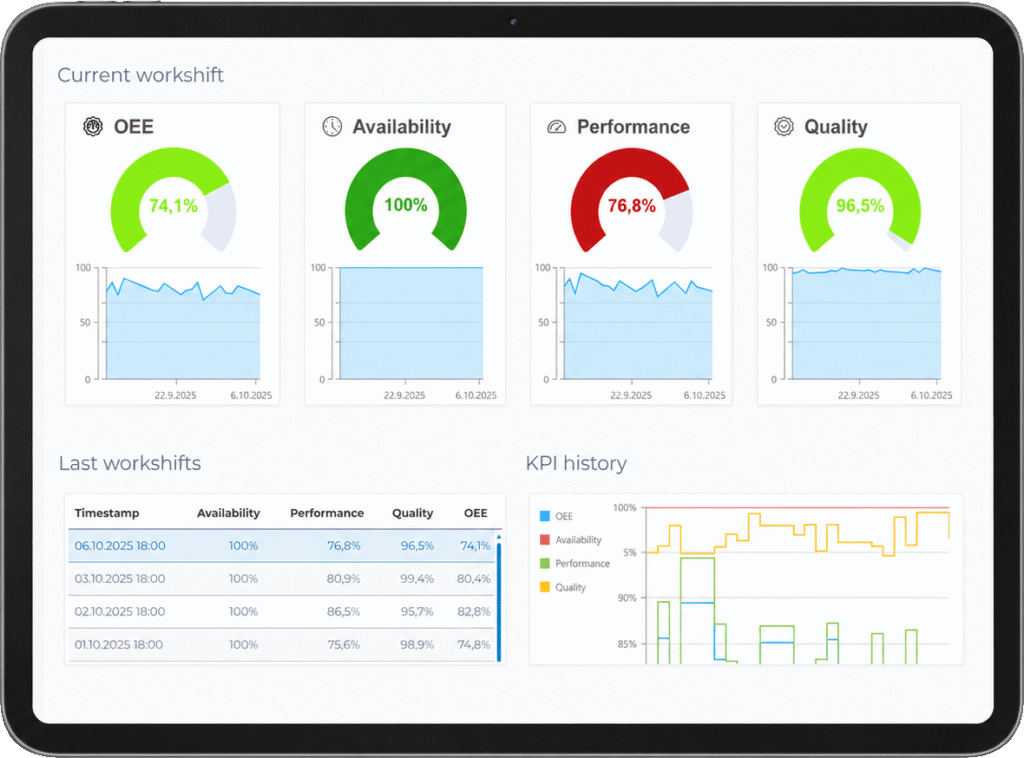
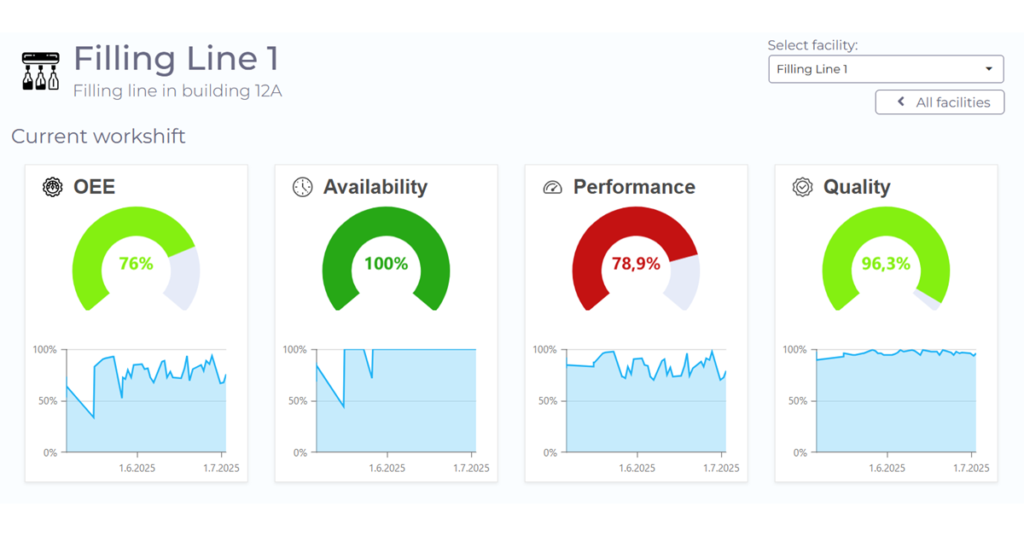
Real-time dashboards and automated reporting
Power BI Alternative for Manufacturing
Capture machine data and operational data on a central platform. Create custom dashboards via drag-and-drop and automate reporting workflows. manubes makes production transparent while saving time and minimising integration effort.
In brief
What is a Power BI alternative for manufacturing?
A Power BI alternative for manufacturing is software that collects machine and operational data directly from controllers and production systems, displays it on real-time dashboards and generates reports automatically – without additional middleware between the shop floor and the BI tool.
Typical Business Intelligence solutions like Microsoft Power BI consolidate data from different sources and offer tools for dashboarding, reporting and analysis. The main target audience are managers and decision-makers who need access to current data, both in daily operations and for long-term strategic decisions.
In manufacturing, however, the most important data comes from machines and equipment. This page shows where conventional BI software reaches its limits, how manubes and Power BI differ and which tool suits which company.
manubes as a Power BI Alternative
Process transparency and trend discovery – with minimum integration effort
Why many BI tools face limitations in production
Manufacturers need to collect machine data, order data, inventory levels and many other types of production data. A Manufacturing Execution System (MES) often provides real-time data for production managers, while BI solutions consolidate higher-level data and present it to executives.
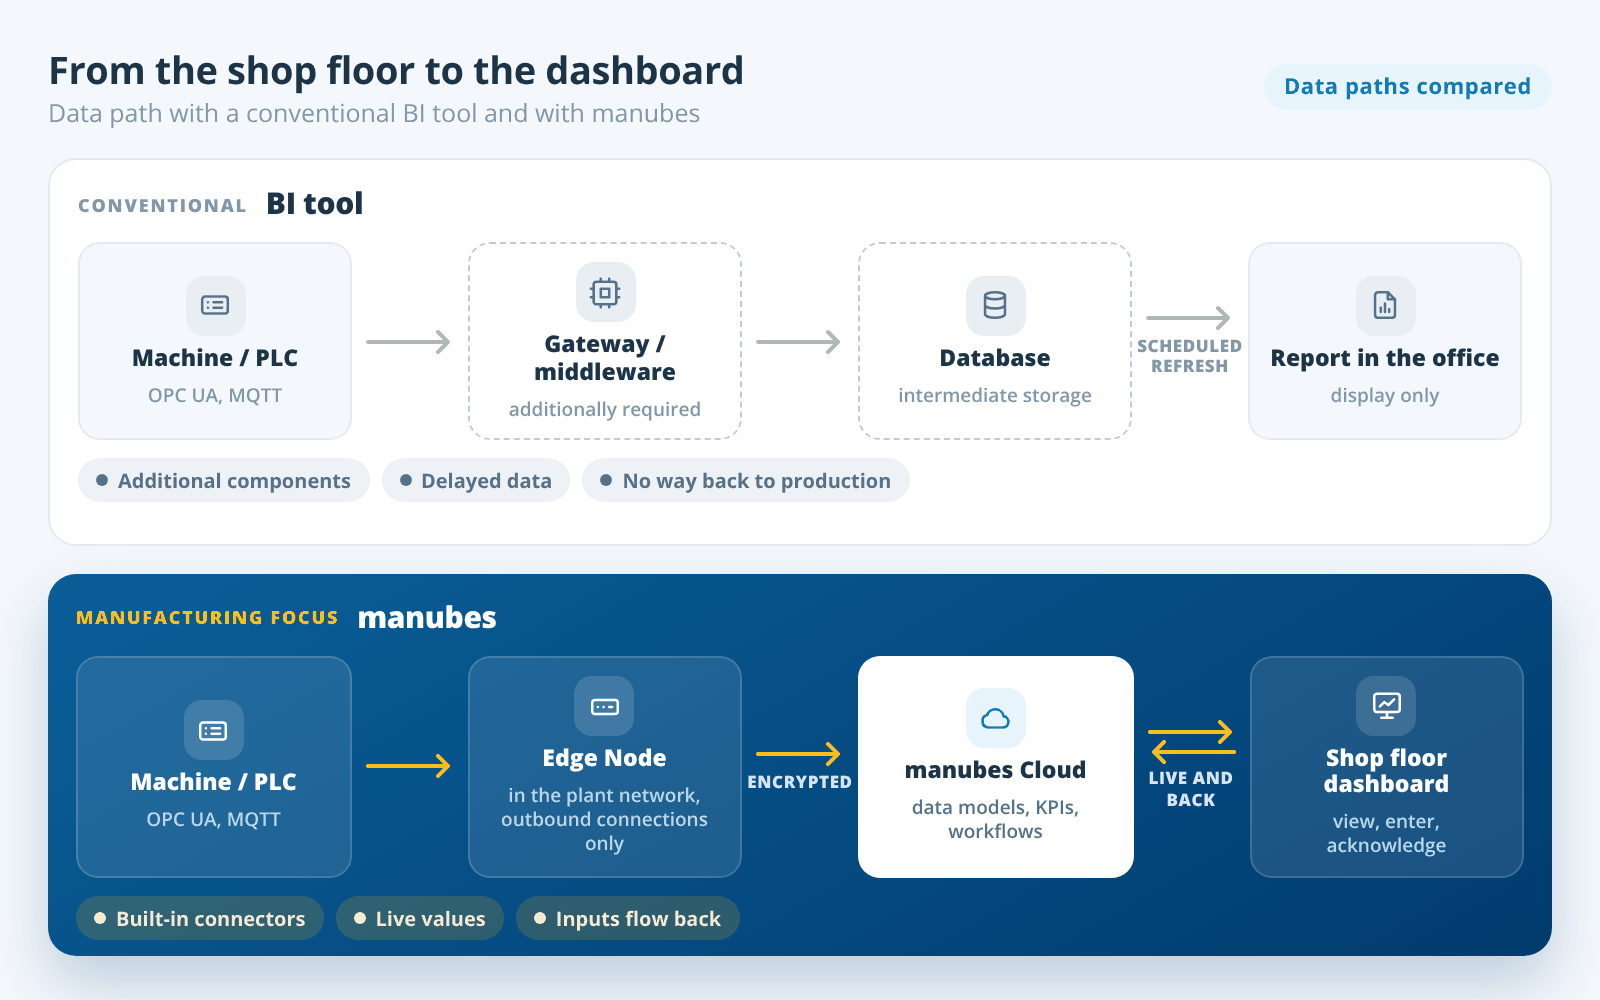
One of the biggest challenges for conventional BI software is handling the data sources and standards used in manufacturing. Power BI and similar solutions focus primarily on business data. In manufacturing, machines and equipment connected via standards such as OPC UA are among the most important data sources. Collecting this data with less specialised BI tools often requires additional middleware and greater integration effort.
In practice, conventional BI tools show three typical limitations:
- Data sources: Power BI has no standard connector for OPC UA. Machine data usually reaches a database via a gateway or middleware, and the BI tool reads it from there.
- Timeliness: Power BI refreshes imported data on a schedule, up to eight times a day with a Pro licence. Since the end of October 2024, new real-time streaming datasets can no longer be created in Power BI; Microsoft refers users to Microsoft Fabric instead.
- Way back: Reports and dashboards are made for analysis. Inputs on the shop floor, such as a downtime reason or an acknowledgement, require additional tools like Power Apps.
Information on Power BI as of October 2026.
Features
manubes – Power BI alternative with a focus on manufacturing
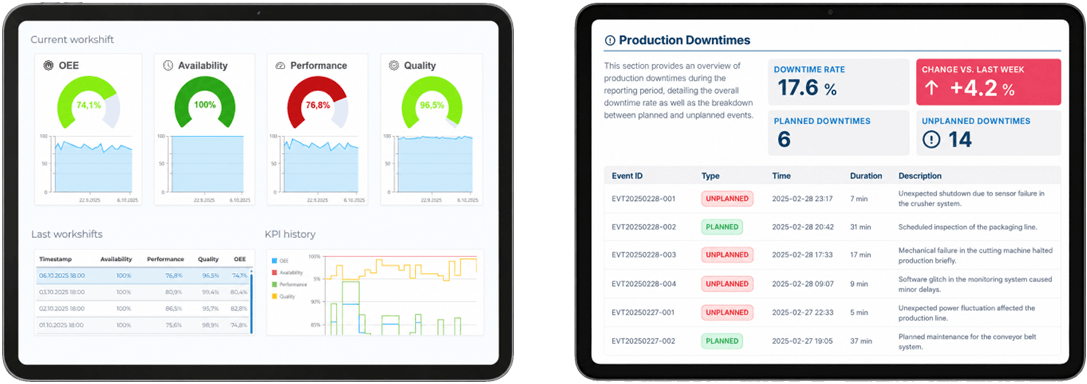
manubes combines real-time production monitoring, process automation and BI functionality on a platform focused on industrial environments. Users can connect machines and production systems via standardised and easy-to-use connectors.
manubes feature overview:
- Dashboard creation via drag-and-drop
- Linking charts to data sources within a few clicks
- Automated reporting with minimum time investment
- Data management with custom data models
- Automated KPI calculations
- AI-powered data analysis
manubes provides visibility across departments and reduces the time required to create dashboards and reports. Intuitive drag-and-drop tools allow manubes users to quickly build the solutions they need – mobile-ready, easy to adapt and protected by granular access controls.
Comparison Table
manubes and Power BI side-by-side
manubes and Power BI both provide core BI capabilities such as dashboards and reporting but focus on different use cases. Power BI’s main advantage is the ability to consolidate and analyse data across departments at the enterprise level.
manubes has a stronger focus on the operational use of production data. Direct connectivity to OPC UA and MQTT data sources reduces integration effort.
Users can add input fields, forms and controls directly to real-time dashboards, allowing them not only to analyse information but also to respond to processes immediately. Production reports can be generated automatically from templates and distributed through workflows.
| Criterion | Power BI | manubes |
|---|---|---|
| Dashboards | Interactive dashboards for different business areas | Interactive dashboards and responsive visualisations with a production focus, integration of control system interfaces |
| Reporting | Interactive and paginated reports, automation and self-service | Dynamic PDF reports, automation and self-service |
| Data integration | Broad IT, cloud and database connector ecosystem | Connectors for OPC UA, MQTT, REST APIs and SQL data sources |
| Data modelling | Semantic models with relationships, calculations, measures and storage modes | User-defined tables and relationships for structuring production-related data |
| Workflow automation | Mostly Power Automate | Integrated workflow designer |
| Real time on the shop floor | Imported data refreshed on a schedule, real-time scenarios via Microsoft Fabric | Live values from machines and equipment directly on the dashboard |
| Inputs on the dashboard | Focus on analysis, inputs via additional tools such as Power Apps | Input fields, forms and controls directly on the dashboard |
| Enterprise BI | Broadly designed, cross-functional | Specialised in production and shop floor data |
| Shop floor applications | Additional components required | Core focus |
Information on Power BI based on public information from Microsoft, as of October 2026.
Connect systems to manubes using integrated edge components and intuitive connectors: Securely, scalably and consistently across systems and production sites.
Decision guide
Power BI or manubes: which suits your company?
Both tools present data on dashboards and in reports. Which software fits better depends on where the data comes from and who in the company works with it.
Power BI is the right choice if …
manubes is the right choice if …
In practice
Typical applications in manufacturing
With manubes, dashboards and reports are created where the data originates. These are the applications manufacturers implement most often.
OEE dashboards
Track availability, performance and quality per line and shift live and compare equipment.
- OEE per shift
- Line comparison
Shopfloor boards
Metrics and feedback for production teams on the factory floor monitor, for example in the shift meeting.
- Factory floor monitor
- Shift meeting
Energy monitoring
Record consumption from meters and machines, detect load peaks and document savings.
- Load peaks
- Consumption per asset
Fault notifications
Inform the people responsible immediately via push notification in the event of downtime or limit violations.
- Downtime
- Limit value
Four steps from machine to dashboard
A production dashboard with the manubes cloud platform needs neither middleware nor programming. It takes four steps.
Connect equipment
An Edge Node in the plant network connects controllers and sensors to manubes via OPC UA or MQTT. The step-by-step guide to connecting an edge device shows how it works.
Structure data
In the Datamodel Designer, you define which values are stored and how they relate to each other, for example machines, orders and shifts.
Create a dashboard
In the Page Designer, you drag charts, KPI tiles and input fields onto the page.
Automate reports and processes
Reports are generated from templates. Workflows distribute them and trigger notifications when deviations occur.
Product video: Get to know manubes
Frequently asked questions about Power BI alternatives
What is a good Power BI alternative for manufacturing?
A good Power BI alternative for manufacturing connects machines directly via OPC UA or MQTT, displays values on real-time dashboards and generates reports automatically. manubes combines these functions on a cloud platform with edge connectivity in the plant.
Is Tableau or Power BI better for manufacturing data?
Tableau and Power BI are both general-purpose BI tools and are strong at analysing business data. For machine data, both usually need a gateway or middleware. A manufacturing platform such as manubes connects controllers directly and shows values live on the shop floor.
Can Power BI read machine data via OPC UA?
Power BI has no standard connector for OPC UA (as of October 2026). Machine data usually reaches the BI tool via a gateway, middleware or a database. manubes reads OPC UA data directly from the controller using the integrated OPC UA client and Edge Nodes.
What is the difference between Power BI and Power Automate?
Power BI analyses data and presents it in reports and dashboards. Power Automate automates processes between applications. In manubes, dashboards and workflows are part of the same platform: the Workflow Designer automates processes directly based on production data.
What alternatives to Power BI are there?
Alternatives include general-purpose BI tools such as Tableau or Qlik Sense, dashboard tools such as Grafana and platforms specialised in manufacturing such as manubes. For data from machines and equipment, what matters most is how easily the data sources can be connected.
Is production data secure in manubes?
manubes connects production exclusively via outbound, encrypted connections. No ports for incoming connections need to be opened in the production network. The manubes security concept describes further details.
Real-time production data instead of yesterday’s reports
In a product presentation, we show you how manubes connects your equipment and which dashboards and reports you can build from the data.
Request a product presentationFurther information