Overall Equipment Effectiveness
OEE: Calculation & Analysis
Overall Equipment Effectiveness (OEE) is one of the most important key metrics in manufacturing. It measures the productivity of equipment, makes losses visible and serves as a tool for long-term improvement.
Definition
What is Overall Equipment Effectiveness (OEE)?
OEE (short for Overall Equipment Effectiveness) is one of the most important metrics in manufacturing. It shows how productively a machine or production line is running and where productivity losses occur.
In practice, OEE is used both to monitor production and equipment performance, as well as to identify problems and uncover long-term improvement potential.
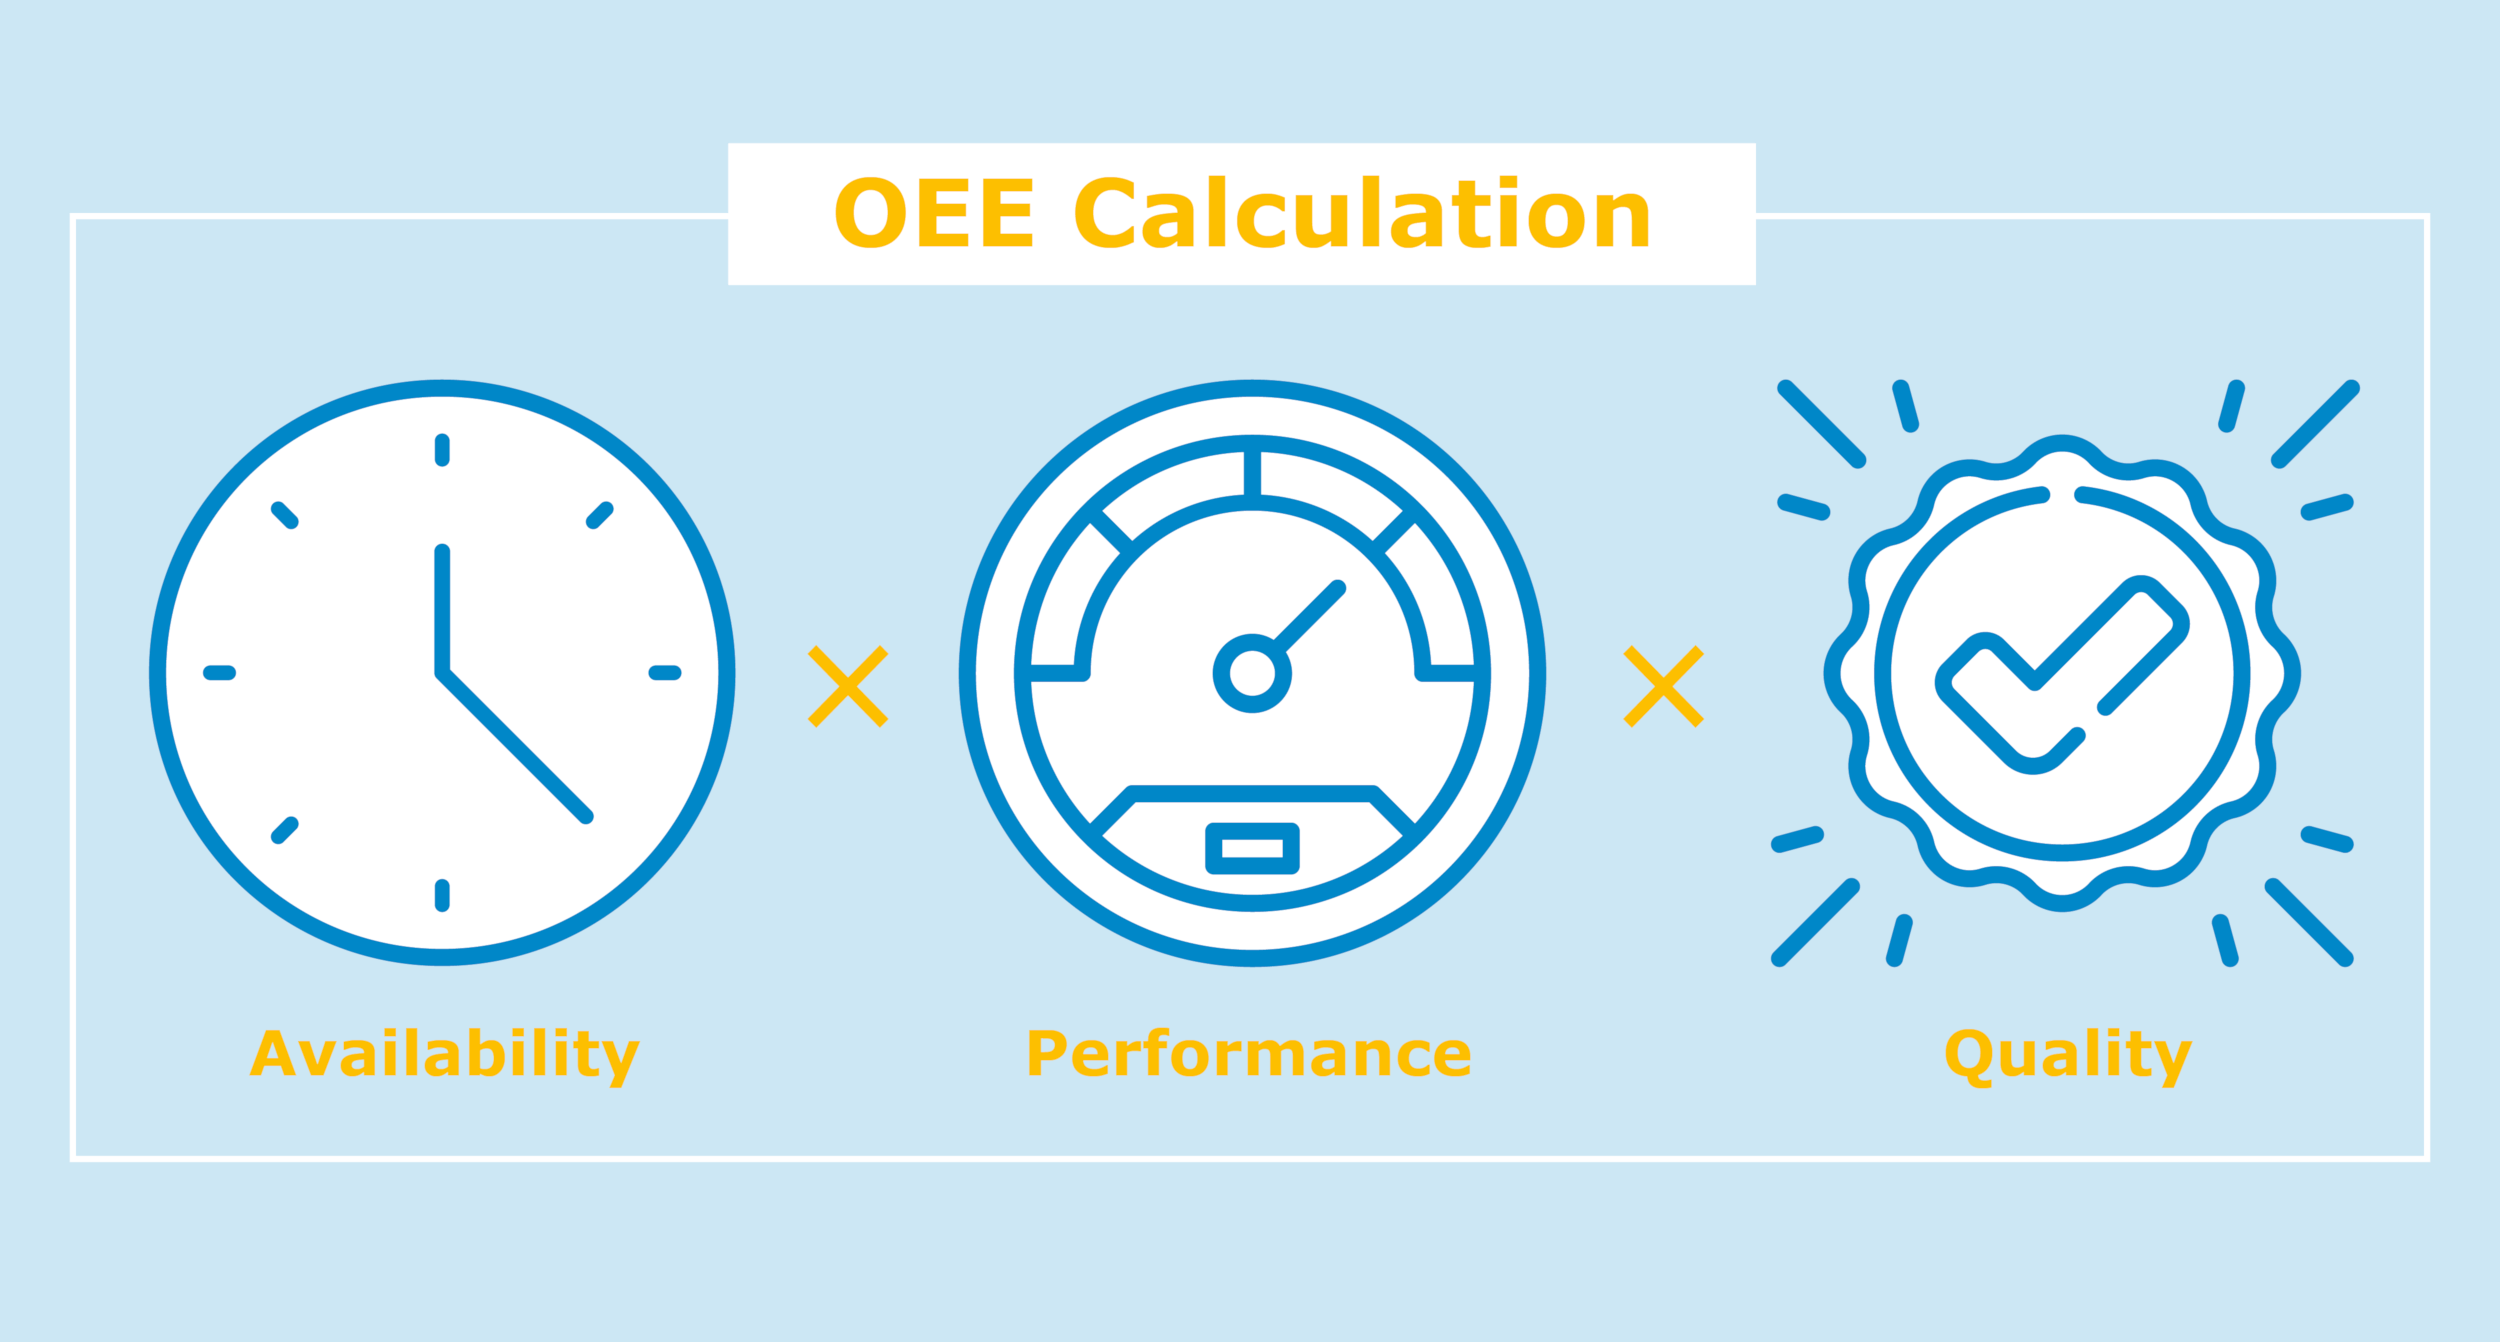
OEE is expressed as a percentage (with a maximum of 100%) and is calculated by multiplying three factors:
Availability:
The share of actual production time compared to planned production time.
Performance:
The share of actual output compared to the maximum possible output.
Quality:
The share of defect-free products compared to the total quantity produced.

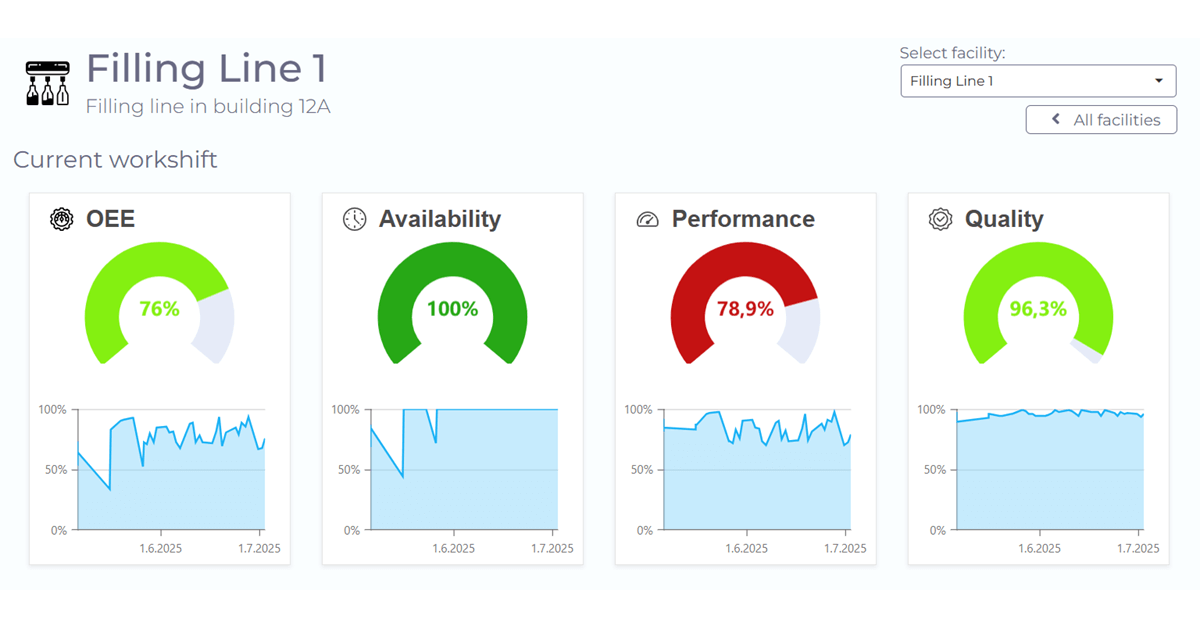
Example of a visualization of the OEE and its components using manubes
Calculation
How is OEE calculated?
To calculate OEE, the values of the three factors Availability, Performance and Quality are multiplied together.
The formula is therefore:
OEE (%) = Availability x Performance x Quality
Both OEE and its individual factors are expressed as percentages ranging from 0% to 100%.
The following section explains what each factor means and how it is determined.

OEE Factor Availability – Calculation and Meaning
Availability is the ratio of actual production time to planned production time.
The calculation formula is:
Availability (%) = Actual production time / Planned production time
Actual production time (runtime) is reduced by both planned and unplanned downtime within the scheduled production window. These are referred to as availability losses and include:
- Maintenance and breaks during planned production time
- Planned setup or changeover times
- Unplanned breakdowns or failures
Before calculating OEE, it must be defined at what point a machine stoppage is counted as downtime under availability. A common rule is a minimum duration of one minute. Shorter stops are instead reflected in the performance factor.
Calculating Availability – Example
In this example, an 8-hour shift is defined as the planned production time. Availability is reduced by several planned and unplanned downtimes.
Planned production time:
480 minutes (shift length)
Downtime during the shift:
- Breaks: 30 minutes
- Setup/changeover: 15 minutes
- Unplanned downtime: 38 minutes
Actual production time:
480 minutes (shift length) – 83 minutes (total downtime) = 397 minutes
Availability = 397 minutes / 480 minutes = 0,8271 = 82,71%
In some models, planned downtimes such as maintenance or breaks are already excluded from the planned production time and therefore do not count as availability losses. This approach allows the focus to be placed entirely on unplanned downtime.
Depending on the objective, both methods can be useful. What matters most is using the chosen approach consistently and clearly documenting the calculation basis.
OEE Factor Performance – Calculation and Meaning
Performance is the ratio of the actual output to the maximum possible output within the given time period.
The calculation formula is:
Performance (%) = Actual output during runtime / Maximum possible output during runtime
The performance factor therefore measures production speed (how many units the machine produces within the actual production time) and compares it to a maximum speed (how many units the machine could theoretically produce in the same time).
The actual output is usually measured directly at the machine. But determining the maximum output or maximum speed is not always straightforward. One option is to use the manufacturer’s specifications, though these are not always available or reliable. Alternatively, companies can utilize historical performance data from the machine (the highest speed achieved in the past). In some cases, the maximum speed can also be calculated directly, e.g. through physical limits.
For performance calculation, the relevant time frame is the actual production time of the machine, as already defined in the availability calculation (see above).
Performance losses occur due to minor stops and slowdowns caused by errors, blockages, or process instabilities.
Calculating Performance – Example
Actual production time:
397 minutes (shift length minus planned and unplanned downtime)
Measured output during actual production time:
18,000 units
Maximum possible output rate:
3,000 units per hour
Maximum possible output during actual production time:
(3,000 × 397) / 60 = 19,850 units
Performance = 18.000 units / 19.850 units = 0,9068 = 90,68%
OEE Factor Quality – Calculation and Meaning
Quality is the ratio of good units to the total number of units produced. Good units are those that do not need to be scrapped or reworked (also called “good output”).
The calculation formula is:
Quality (%) = Number of good units / Total number of units produced
Quality losses can have many different causes such as low-quality materials, machine or tool wear or unstable processes. A more detailed look at scrap and defect causes can be found on our page about the reject rate and how to reduce it.
One important aspect of quality is the fact that it is not always measured or detected at the machine where the defect actually originates. In addition, quality losses recorded for one machine are often linked to earlier processing steps on other machines. As a result, identified quality losses often serve as a trigger for cross-machine root cause analysis.
Calculating Quality – Example
Output during actual production time:
18,000 units
Of which good units:
16,983 units
Quality = 16,983 units / 18,000 units = 0.9435 = 94.35%
Overall OEE Calculation – Example
Based on the calculated values for Availability, Performance, and Quality from the previous sections, we determine OEE by multiplying the three factors together.
OEE = 0,8271 x 0,9068 x 0,9435 = 0,7076 = 70,76%
Application and Analysis
Using and analyzing OEE in practice
In practice, OEE is primarily used to make losses visible – meaning all the obstacles that prevent equipment from running at its optimal level (OEE = 100%).
Breaking OEE down into its three factors Availability, Performance and Quality makes it easier to pinpoint the causes of problems and to focus further analysis and improvement efforts on specific areas.
OEE also plays an important role in short-term production monitoring. It is often integrated into OEE dashboards that not only visualize and track individual machines, but also allow comparison across different machines, production lines, or even entire plants. Used like this, OEE provides a quick overall view of productivity across different areas.
For which machines should OEE be calculated?
OEE delivers the greatest impact when it is calculated at so-called constraints – machines or processes that limit overall production output, often because they run slower than the rest of the line.
Focusing on bottleneck machines makes sense, because improving their OEE directly translates into a real increase in productivity. Of course, these constraints can shift over time, especially when targeted improvements are made.
Beyond bottlenecks, OEE is also tracked on strategically important machines such as highly cost-intensive equipment, processes with high quality risks or steps that are critical from a customer perspective.
In principle, OEE can also be calculated for entire production lines or even whole plants although this shifts the meaning of the metric.
A line-wide or plant-wide OEE combines the performance of multiple machines into one overall figure. This provides a simplified overview that is useful for comparing sites or production areas, spotting trends or setting top-level performance targets.
For concrete improvement measures, these higher-level aggregated values are less useful, since the specific causes of losses are hidden within the summary.
What is a good OEE value?
There is no universally “good” OEE value, since OEE depends heavily on the industry, production environment and specific objectives. In many cases, values between 80% and 90% are considered very good.
What matters most is not the absolute benchmark but continuous improvement. OEE highlights where losses occur and serves as a guide to measure the effectiveness of improvement initiatives.
How can OEE be optimized?
Optimizing OEE focuses on its three components: Availability, Performance and Quality. In practice, this means reducing downtime, increasing throughput speed and minimizing quality losses. Typical measures include adjusting maintenance strategies and schedules, improving process stability and employee skills and addressing frequent root causes of scrap.
A “blind” optimization of OEE, is not always meaningful, since the metric does not account for factors such as cost. While frequent preventive maintenance outside production hours, higher staffing levels or the use of premium materials may improve OEE, they are not always economically viable.
Similarly, increasing batch sizes can reduce setup time and improve availability, but this is not always desirable and often conflicts with lean manufacturing principles.
Nevertheless, OEE remains an important tool in production management. Systematically eliminating sources of loss usually goes hand in hand with a long-term improvement in OEE.
FAQ
Other frequently asked questions about OEE
Can OEE be at over 100%?
No, the maximum OEE value is 100%.
If an OEE calculation results in a value above 100%, it indicates that the maximum production output/speed used in the performance factor calculation was set too low.
What is the relationship between OEE and TPM?
Total Productive Maintenance (TPM) is a production optimization approach aimed at completely eliminating losses, waste, safety risks and environmental hazards by involving employees more directly in maintenance processes.
OEE and its three factors are key metrics within TPM, helping to measure the impact and effectiveness of improvement initiatives.
How do companies collect the data to calculate OEE?
Today, data for calculating OEE and its factors is often collected automatically. Machine controls (PLCs) provide information on runtime and production output. Data on good units and scrap can also be captured automatically (e.g. via inspection stations or camera systems) or manually with operator input support.

Transparent Production. Optimized Processes.
Manage production data on a central platform and create your own dashboards, workflow automations and mobile applications.
manubes offers the right tools to optimize your production – flexible and easy-to-use.
Try manubes for free
Test the different manubes features in your personal cloud environment.
