Visualization of OEE Data
OEE Dashboards and Reports
for Production
The Overall Equipment Effectiveness (OEE) makes productivity losses visible and supports the monitoring of production equipment. We’ll show how you can visualize OEE as part of dashboards and reports.
To fully leverage the benefits of the OEE metric, clear and accessible visualizations are essential.
OEE dashboards provide a real-time overview of the productivity of selected machines or lines, making them useful for daily production monitoring. These dashboards often display live values, calculated from machine data and updated every few seconds.
OEE reports, on the other hand, typically focus more on long-term production optimization and reveal OEE trends over time. Modern reporting solutions like manubes streamline reporting by linking report templates with data sources, minimizing both effort and errors.

Dashboards
OEE Dashboards: Real-time insights into machine performance
OEE dashboards provide a quick overview of the productivity of individual machines or production lines. They help identify issues early and enable rapid responses to downtime, performance loss or quality issues – especially when OEE values are available in real-time.
Dashboards can focus on individual assets or provide comparisons across multiple machines, lines or facilities.
Comparison of production lines and equipment
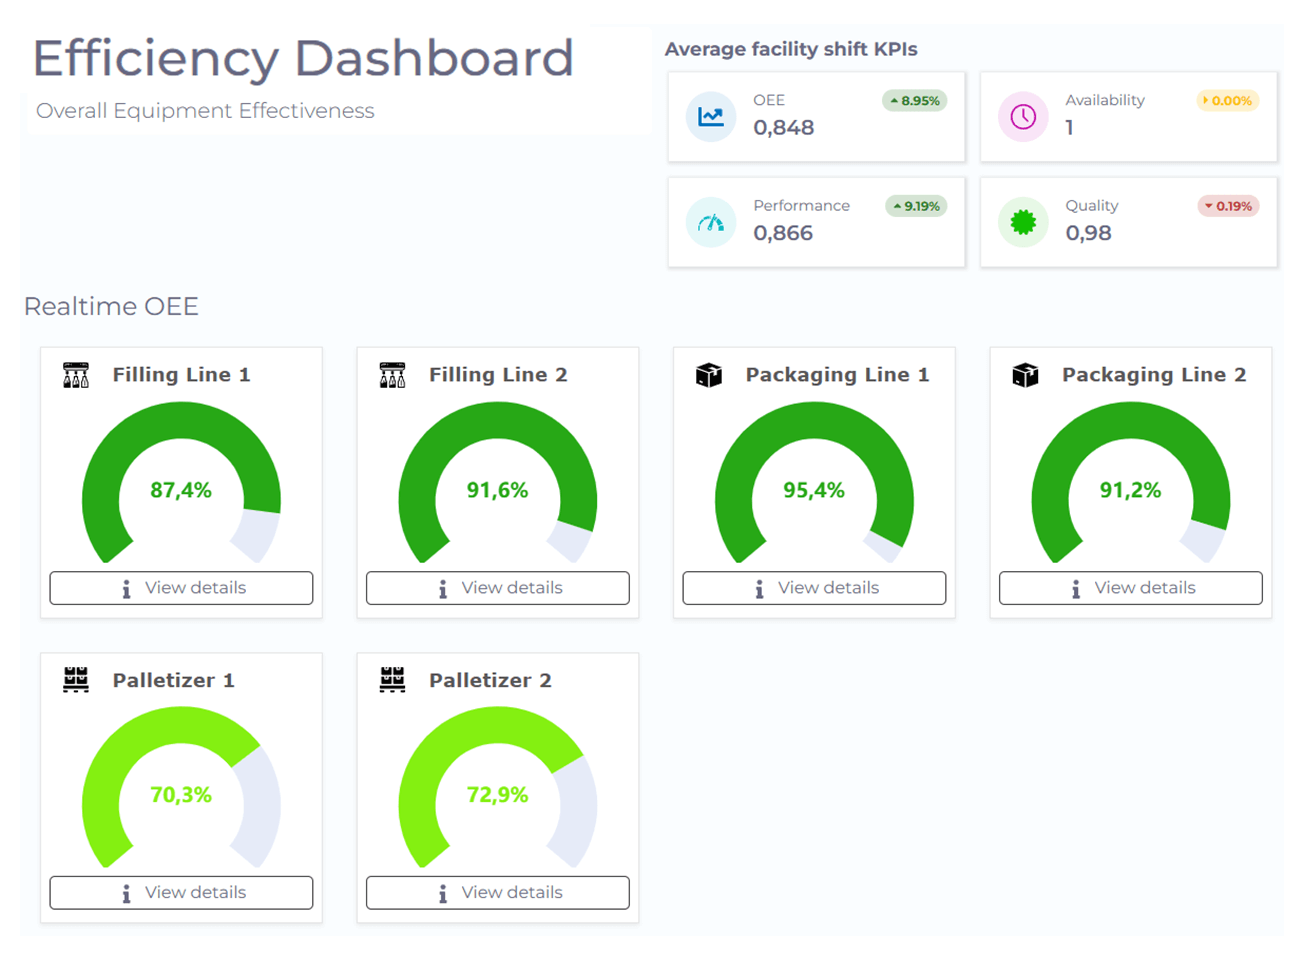
OEE dashboards can compare the performance of different production lines, making deviations visible at a higher level.
They serve as an important monitoring tool in larger production environments and provide a starting point for more detailed analysis.
OEE values can be visualized using color indicators and graphical elements such as gauge charts, allowing personnel to instantly recognize the production current status and potential need for action.
Percentage changes compared to previous periods can help put values into context quickly.

Comparison of OEE values across different machines with manubes. Through links, users can navigate to more detailed individual views.
Overview of individual machines
Individual machines often play a key role in a plant’s overall productivity. Even short downtimes or malfunctions can lead to bottlenecks and significant costs, which is why critical equipment is typically monitored around the clock.
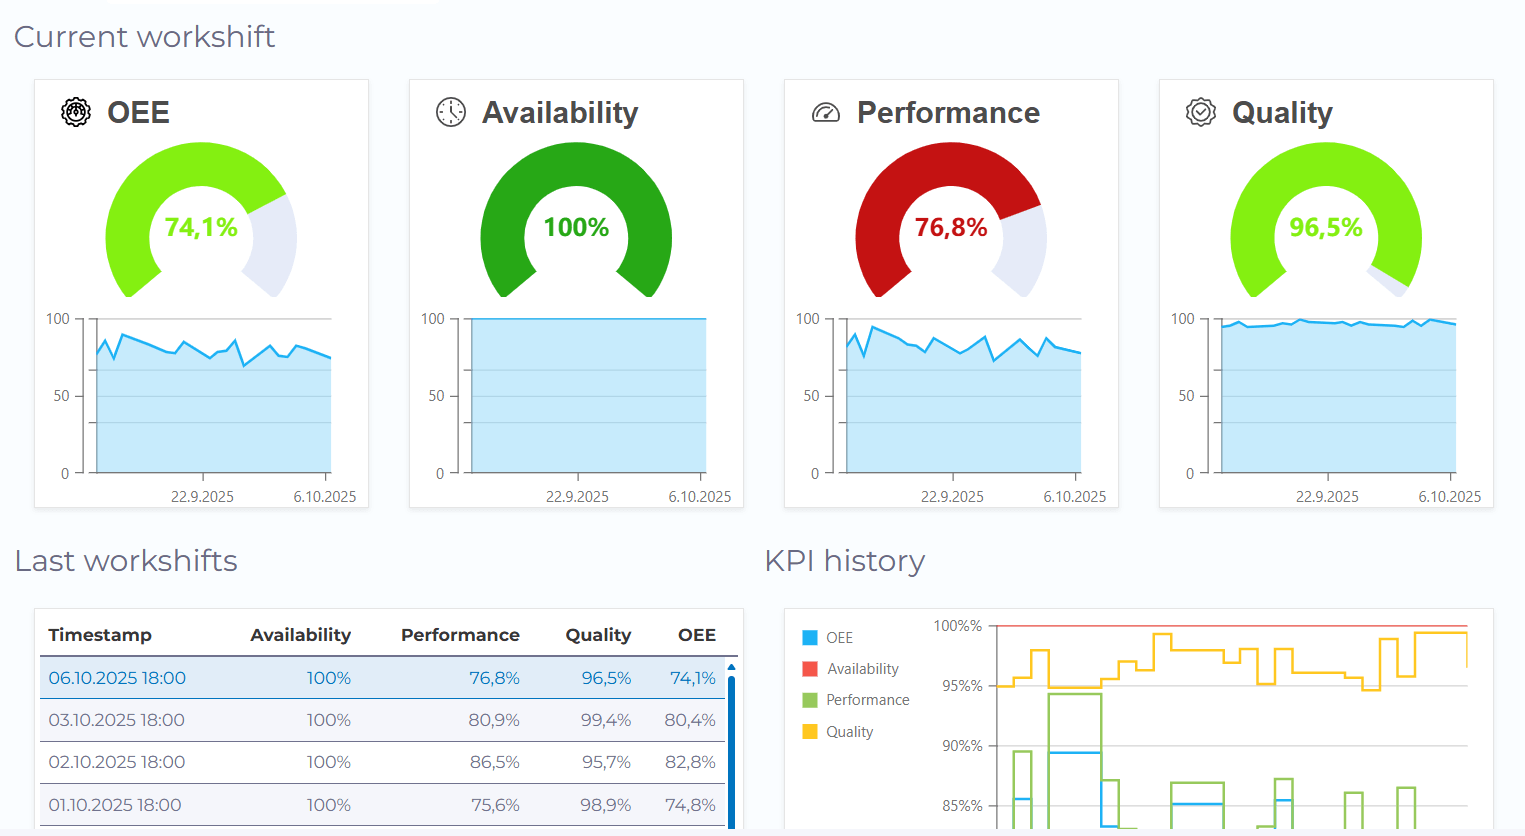
With manubes, you can create overview pages for individual machines that visualize not only OEE values but also selected process parameters and other data provided by controllers and sensors.
If required, data can also be sent directly back to the machine.

Detailed view of an asset’s current OEE and historical performance trends
With manubes, you can create custom manufacturing dashboards for any device – from smartphones to large shop floor displays.
Choose from a wide range of visualization options and connect individual elements to production data sources to display process parameters, status information and many other metrics in real time.
manubes supports standard interfaces such as OPC UA, enabling easy integration of existing machines, devices, databases and software systems.
Reports
OEE Reports: Comprehensive insights into trends and areas for optimization
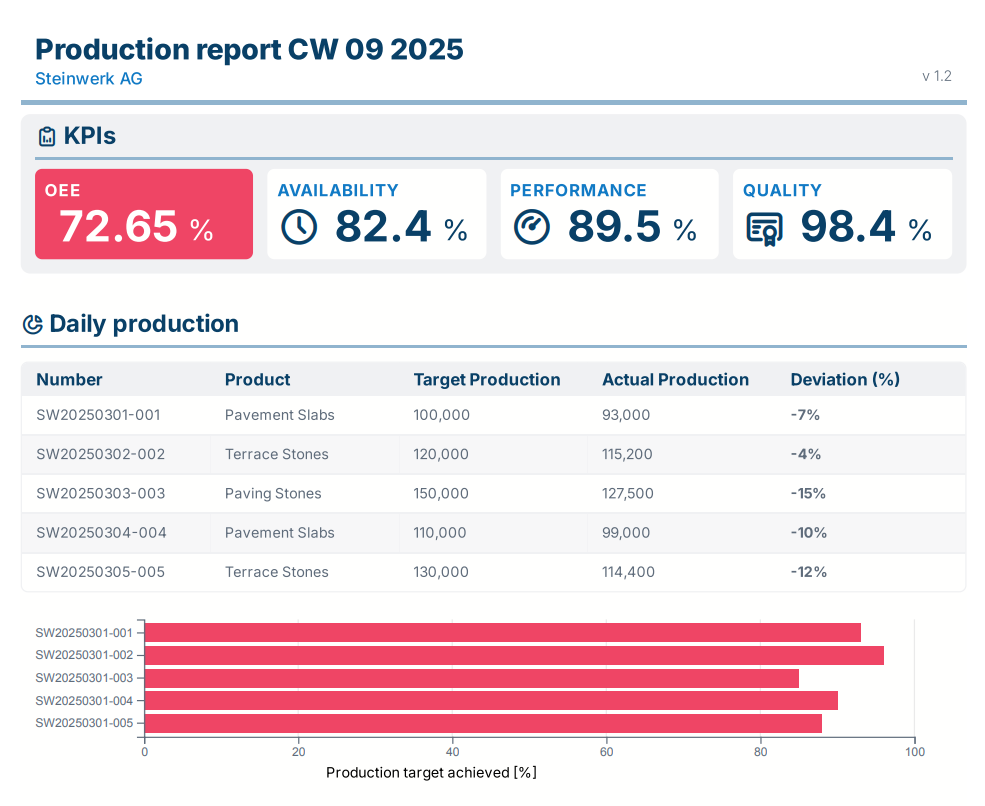
Production reports provide detailed insights into manufacturing performance, focusing on specific time periods, areas, and production metrics. They reveal current trends and often serve as a data foundation for long-term production optimization.
OEE and its sub-factors are common components of production reports. Unlike real-time dashboards used on the shop floor, OEE reports typically include additional data such as recorded downtimes, scrap/reject rates, and other performance issues that form the basis for calculated OEE values.
Creating meaningful OEE reports requires not only clear visualization but also data completeness, accuracy and timeliness.
With the manubes reporting tools, you are able to design custom report templates and link them to (real-time) data sources. This ensures your reports always contain the latest information while reducing data preparation time and minimizing errors resulting from manual input.
Reports can be generated automatically within workflows and distributed via email or made available on-demand through web portals.

An OEE report created with manubes
Try manubes for free
Test the different manubes features in your personal cloud environment.
