Transparent Data Visualization
manubes Page Designer
Create your own dashboards, real-time visualizations and application UIs. The Page Designer makes production transparent and provides options for interactive production control.
Custom Page Design
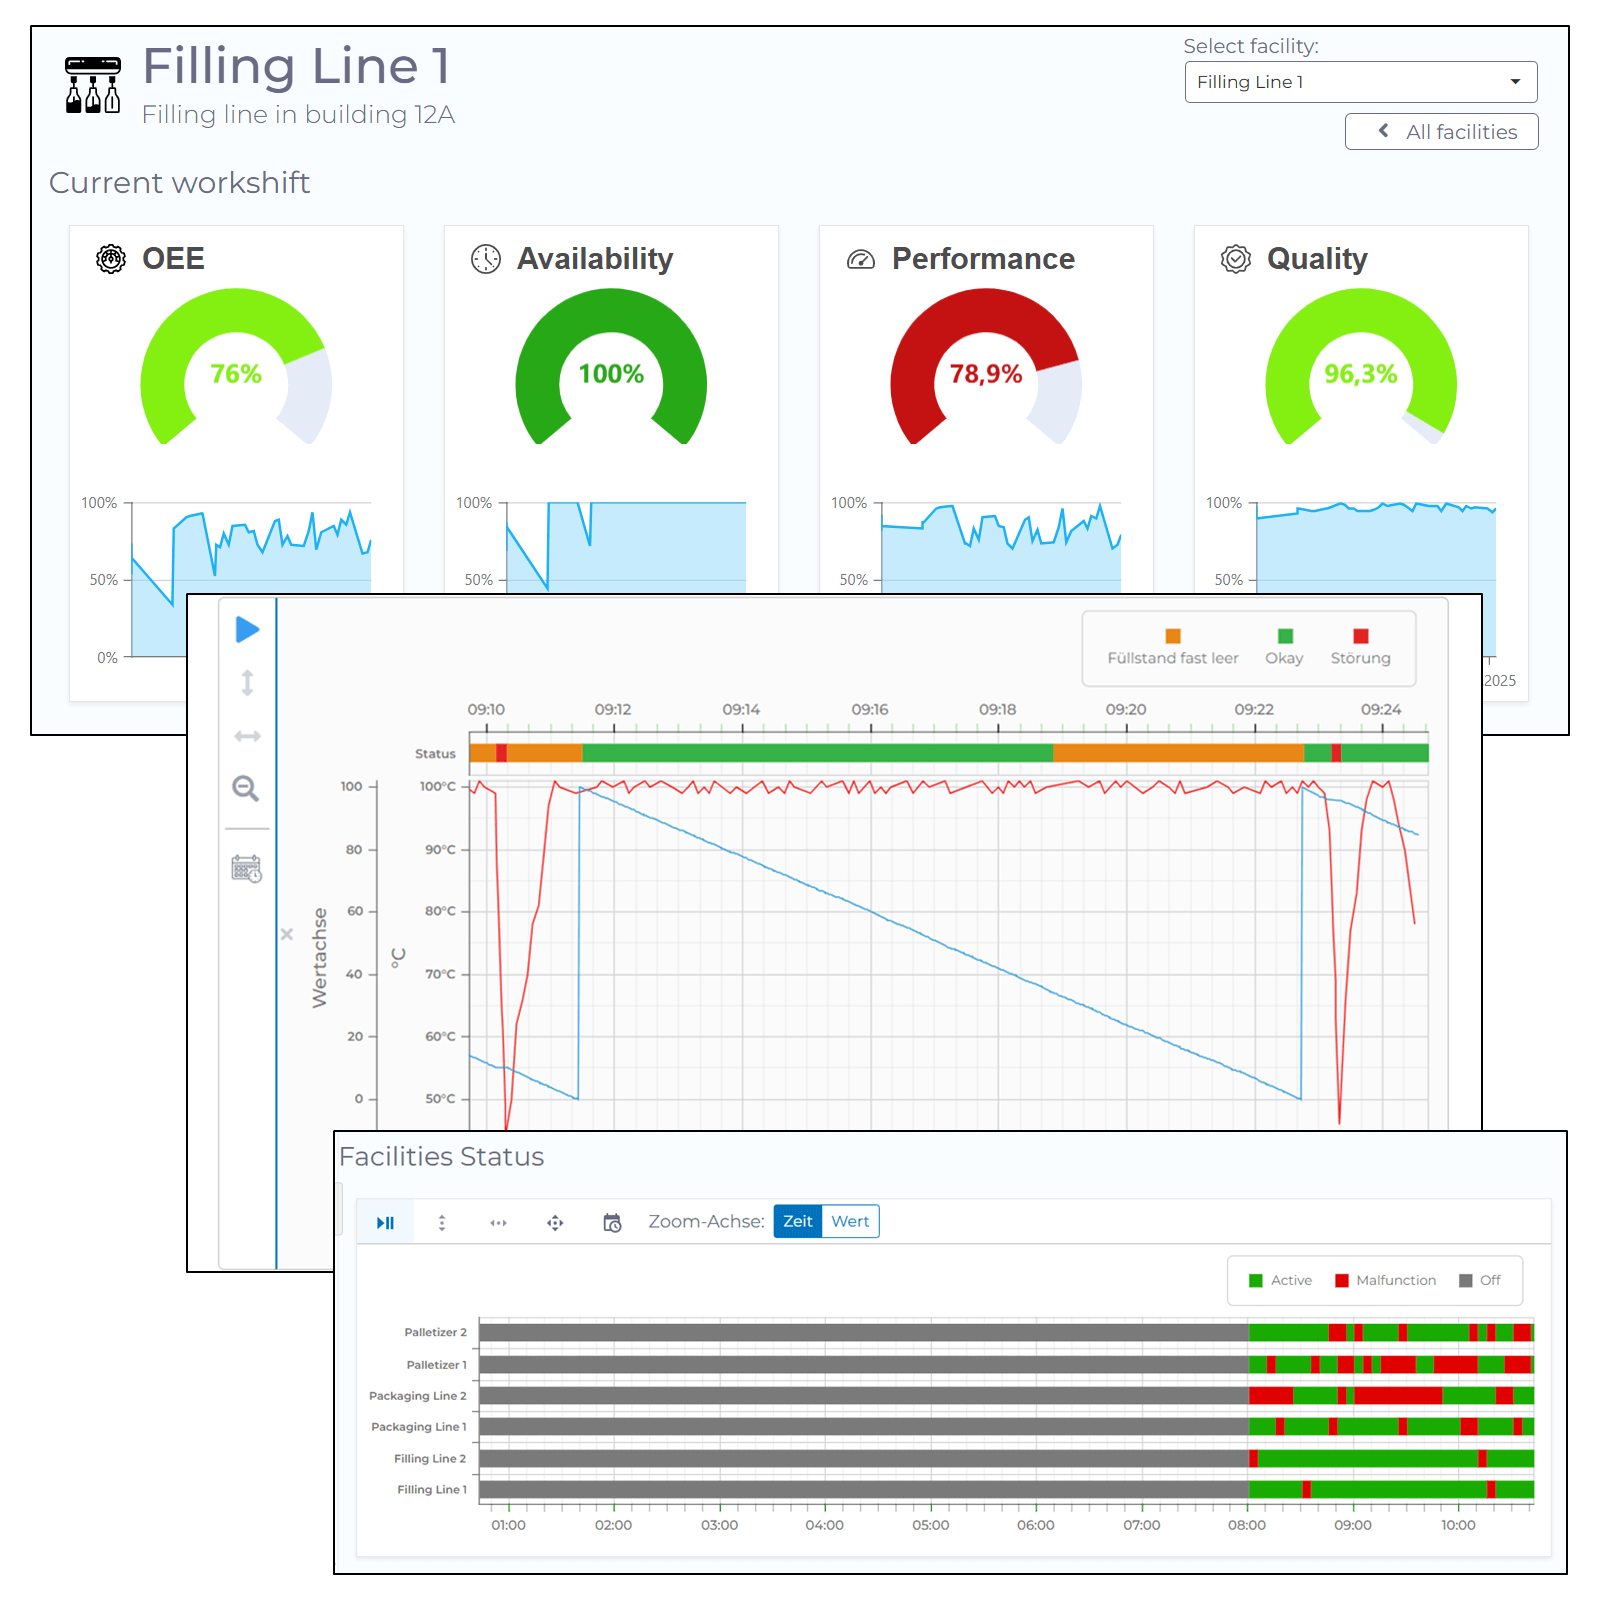
Real-time data visualization and interactive process control
With the manubes Page Designer, you are able to easily create visualizations and interactive interfaces via drag-and-drop.
Use dashboards and overview pages to monitor the status of your equipment and link visualizations to real-time data sources in production.
Create interactive control options by designing intuitive user interfaces that enable direct data transmission to production systems.
Custom Page Design
Real-time data visualization and interactive process control

With the manubes Page Designer, you are able to easily create visualizations and interactive interfaces via drag-and-drop.
Use dashboards and overview pages to monitor the status of your equipment and link visualizations to real-time data sources in production.
Create interactive control options by designing intuitive user interfaces that enable direct data transmission to production systems.
Intuitive Operation, Tailored Visualizations
Flexible design via drag-and-drop
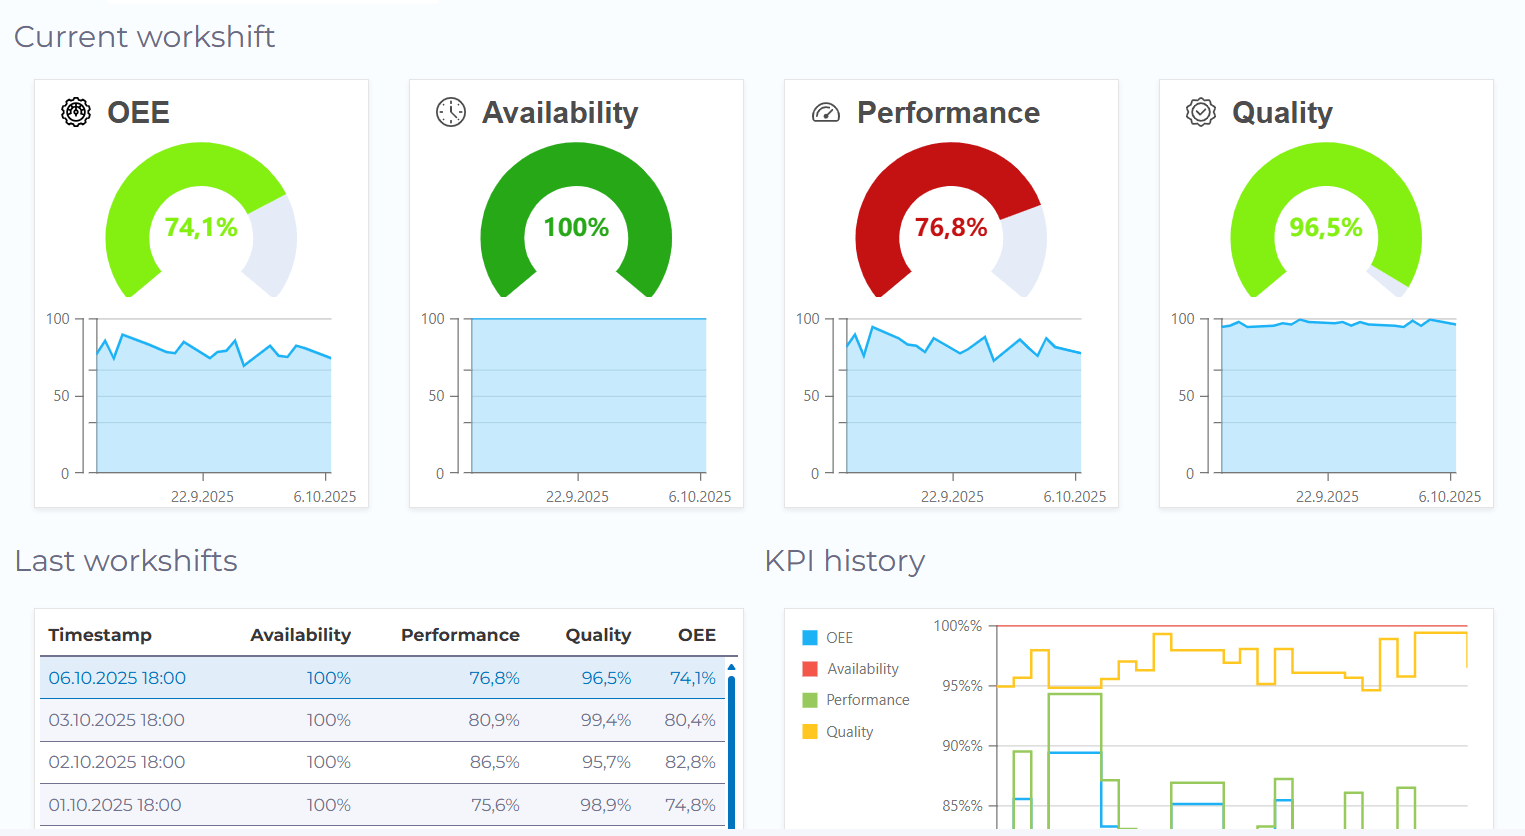
The Page Designer offers an intuitive user experience: Add relevant content via drag-and-drop and link charts and other elements to the appropriate data sources.
manubes supports a wide range of visualization options, including tables, gauge controls, time series charts and KPI cards. Multimedia elements such as images and videos can provide additional context, while buttons, forms and upload fields enable various user interactions.
Responsive Display
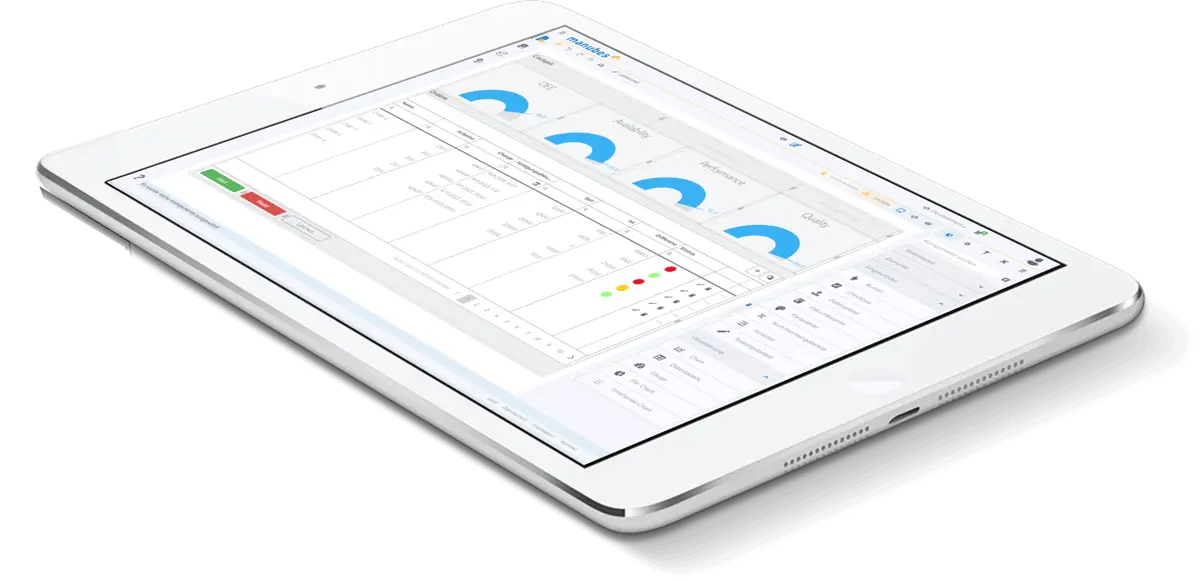
Available on every device
Use your dashboards and applications on any device – from desktop PCs, smartphones and tablets to shop-floor monitors and operator panels.
manubes supports a flexible and responsive design, allowing you to keep track of your production status at all times – whether on the shop floor or in the office.
Intuitive Operation, Tailored Visualizations
Flexible design via drag-and-drop

The Page Designer offers an intuitive user experience: Add relevant content via drag-and-drop and link charts and other elements to the appropriate data sources.
manubes supports a wide range of visualization options, including tables, gauge controls, time series charts and KPI cards. Multimedia elements such as images and videos can provide additional context, while buttons, forms and upload fields enable various user interactions.
Responsive Display
Available on every device

Use your dashboards and applications on any device – from desktop PCs, smartphones and tablets to shop-floor monitors and operator panels.
manubes supports a flexible and responsive design, allowing you to keep track of your production status at all times – whether on the shop floor or in the office.
Try manubes for free
Get started with the Page Designer and other manubes features in your personal cloud environment.
Make production transparent with the Page Designer
Link pages with existing data models, real-time data sources and workflows to create complex applications that support your production management.
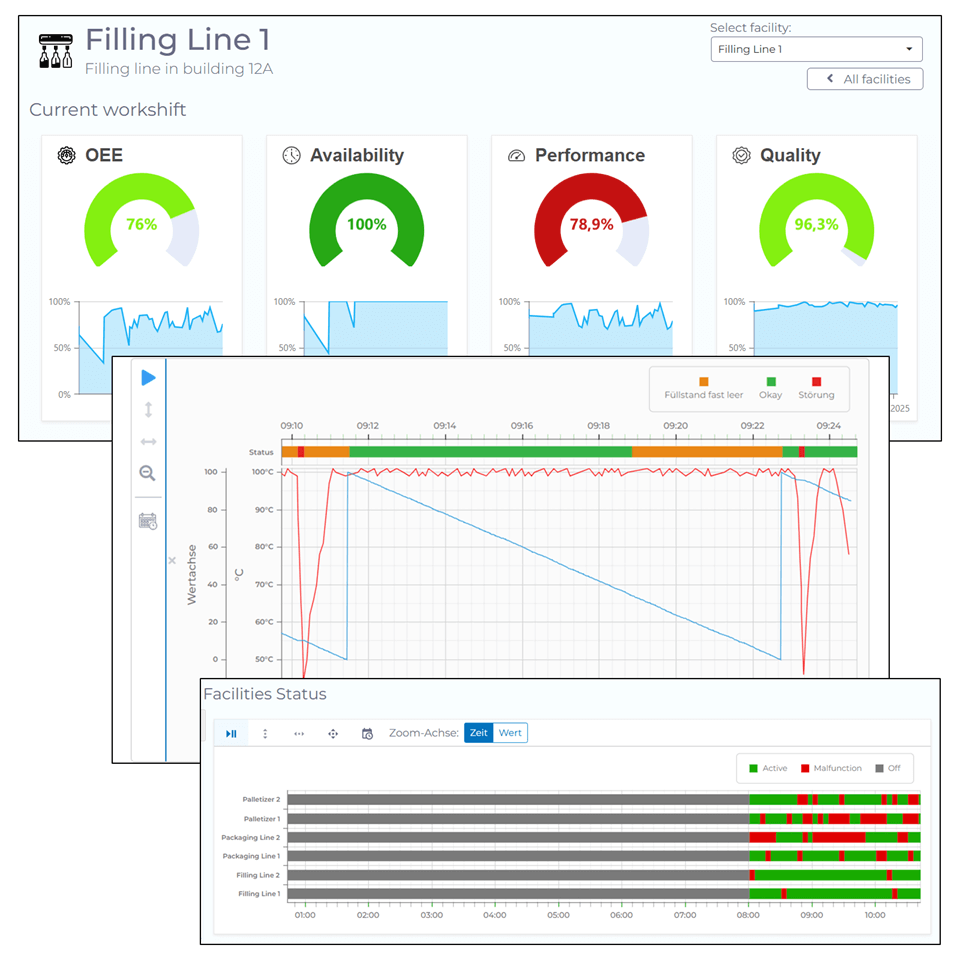
Real-time Dashboards
With manubes, you are able to create the right dashboard for any situation. Visualize key metrics, process parameters, machine statuses or order information using both real-time and historical data.
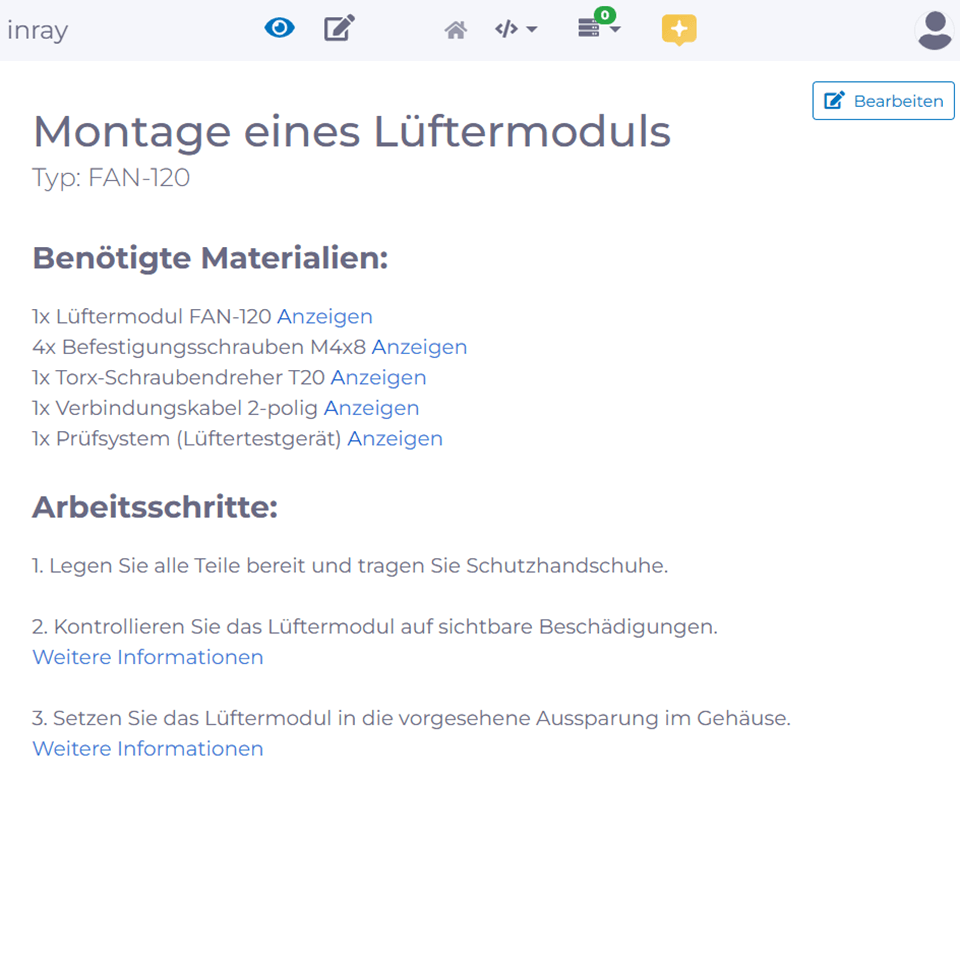
Digital Work Instructions
Provide interactive instructions, work aids and documentation to support teams with various tasks – integrated with real-time data and accessible on mobile devices.
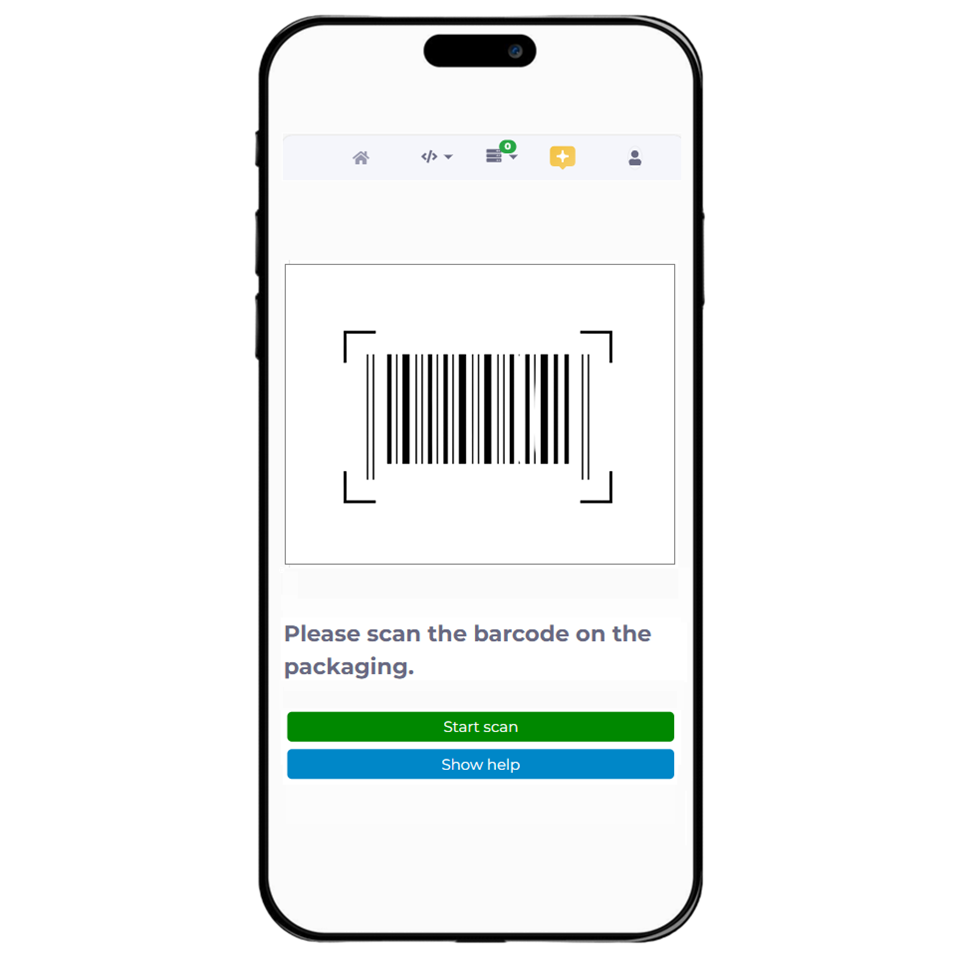
Data Processing with Code Scans
Scan QR codes and barcodes to capture, verify and transmit data more efficiently. Verify deliveries, display error codes on machines or trace tools and products.
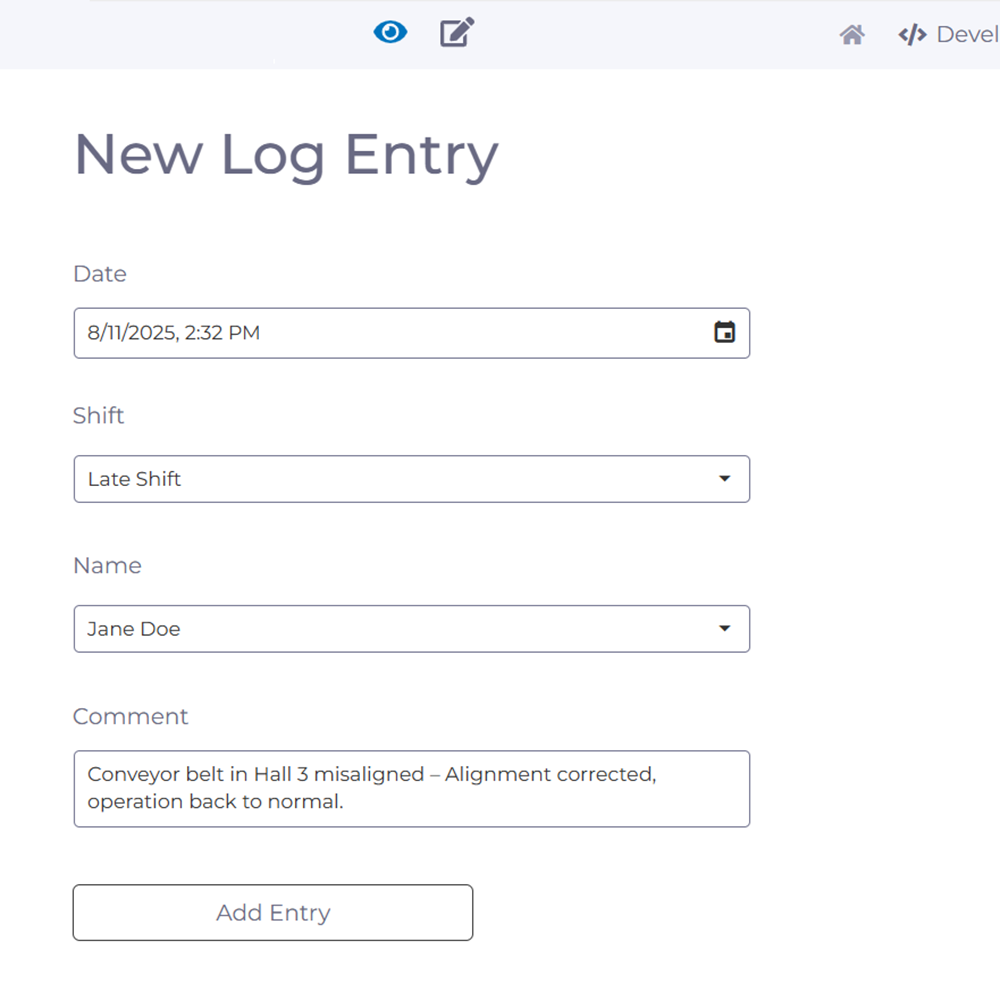
Digital Shift Log
Log shift events through a simple web interface to increase transparency and streamline shift handovers. This gives subsequent teams a quick overview of relevant incidents.
Try manubes for free
Test the different manubes features in your personal cloud environment.
