Data Visualization with manubes
Flexible Real-time Dashboards
for Manufacturing
manubes lets you create individualized manufacturing dashboards for display on any device. Connect a wide range of visualization elements to real-time data sources and ensure maximum transparency in your production processes.
Transparency through real-time data visualization
Keep track of your production – anytime and everywhere
Effective production dashboards provide insights into the current state, highlight exceptions or successes, and offer guidance for various teams on the shop floor. A clear, real-time display of production data enables quick responses and prepares workers for upcoming processes.
With manubes, you can create custom dashboards tailored to your production environment – quickly, easily, and for any device.
Thanks to interface support and no-code design tools, displaying machine data and KPIs in real time becomes effortless.
A wide range of visualization tools
The most important information at a glance
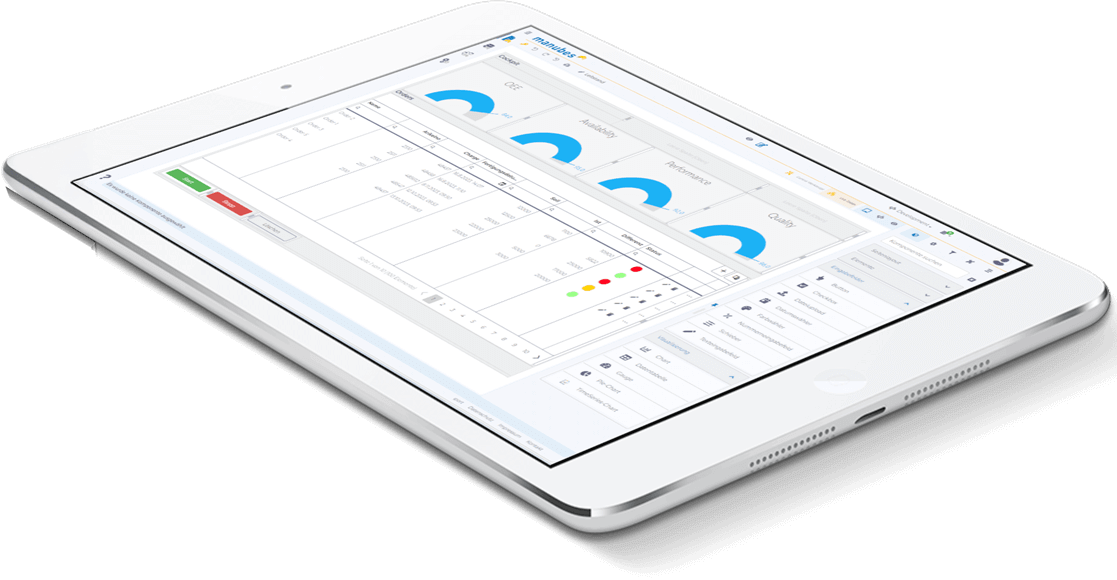
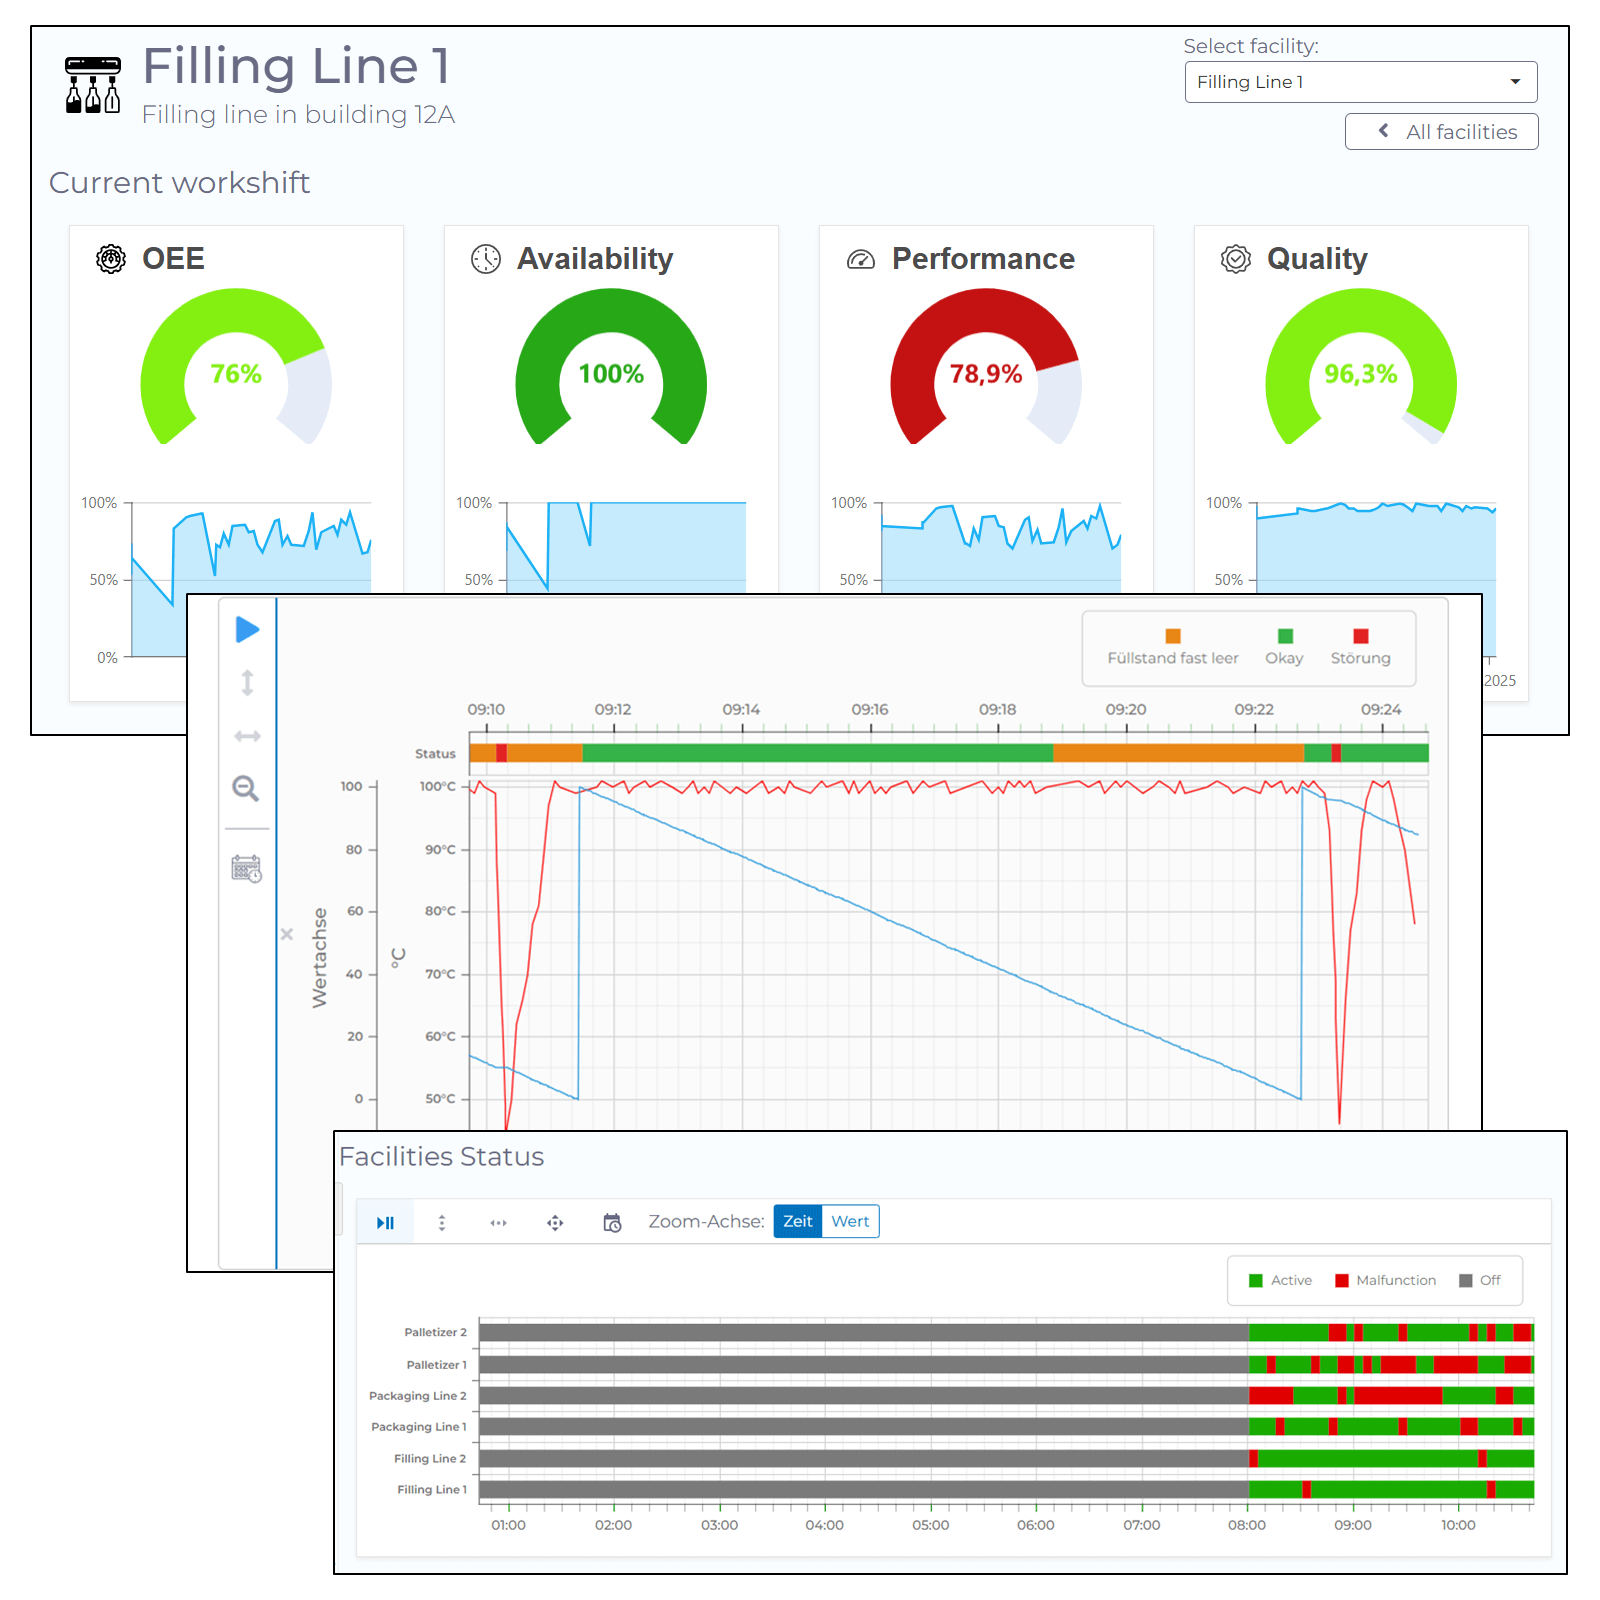
manubes offers a wide range of visualization elements for creating custom dashboards.
- Use KPI cards and gauge charts to display key production metrics
- Visualize process parameters with time series charts, bar charts, or pie charts
- Display machine status using the status indicator
- Present order data in list or table format
Your possibilities with manubes are endless: View data in real time, analyze historical trends or show percentage changes compared to the previous day.
Combine the ideal visualization format with color indicators and matching icons to make information instantly understandable.
Transparency through real-time data visualization
Keep track of your production – anytime and everywhere
Effective production dashboards provide insights into the current state, highlight exceptions or successes, and offer guidance for various teams on the shop floor. A clear, real-time display of production data enables quick responses and prepares workers for upcoming processes.
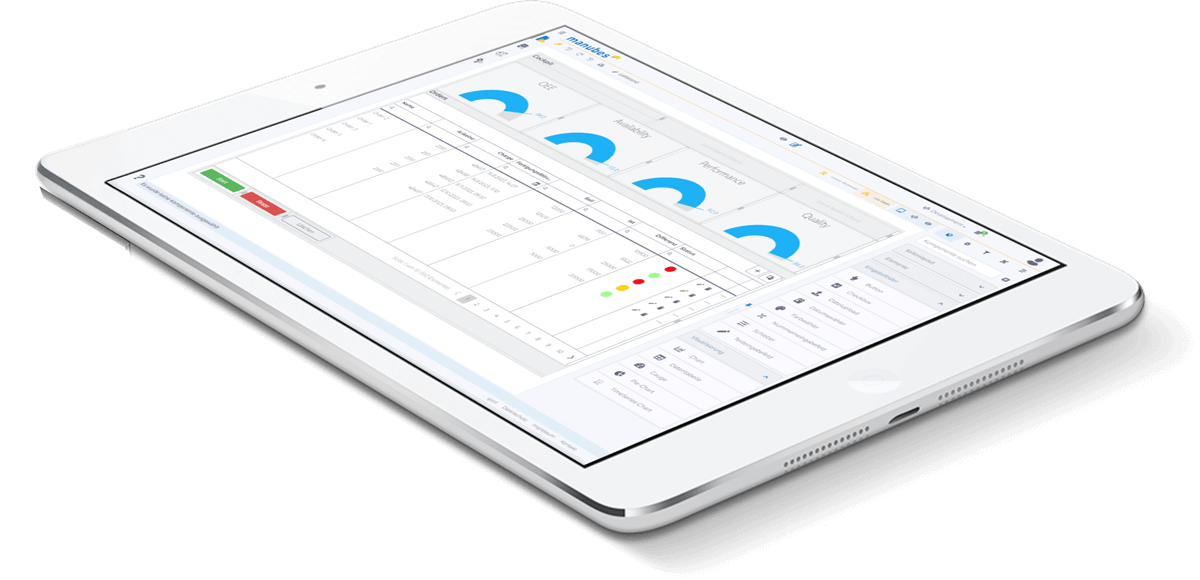
With manubes, you can create custom dashboards tailored to your production environment – quickly, easily, and for any device.
Thanks to interface support and no-code design tools, displaying machine data and KPIs in real time becomes effortless.
A wide range of visualization tools
The most important information at a glance

manubes offers a wide range of visualization elements for creating custom dashboards.
- Use KPI cards and gauge charts to display key production metrics
- Visualize process parameters with time series charts, bar charts, or pie charts
- Display machine status using the status indicator
- Present order data in list or table format
Your possibilities with manubes are endless: View data in real time, analyze historical trends or show percentage changes compared to the previous day.
Combine the ideal visualization format with color indicators and matching icons to make information instantly understandable.
No-code design tools
Simple configuration
Create professional dashboards effortlessly via drag-and-drop and link visualization elements to real-time data sources in just a few clicks.
Use the guided component configuration to filter, sort or aggregate data as needed.
manubes is fully no-code, enabling even end users to create effective visualizations.
Responsive display
Compatible with any device
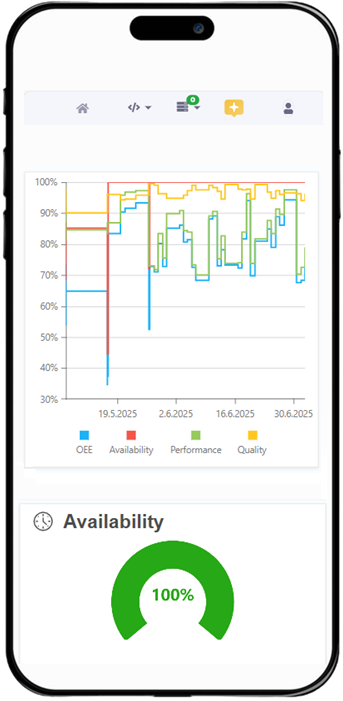
Access your dashboards from anywhere: Responsive design ensures compatibility with a wide range of devices.
- Shop floor monitors in the production hall
- Operator panels near machines
- Desktop PCs
- Smartphones or tablets
- Specialized industrial devices
No-code design tools
Simple configuration
Create professional dashboards effortlessly via drag-and-drop and link visualization elements to real-time data sources in just a few clicks.
Use the guided component configuration to filter, sort or aggregate data as needed.
manubes is fully no-code, enabling even end users to create effective visualizations.
Responsive display
Compatible with any device

Access your dashboards from anywhere: Responsive design ensures compatibility with a wide range of devices.
- Shop floor monitors in the production hall
- Operator panels near machines
- Desktop PCs
- Smartphones or tablets
- Specialized industrial devices
Interfaces
Where does the data come from?
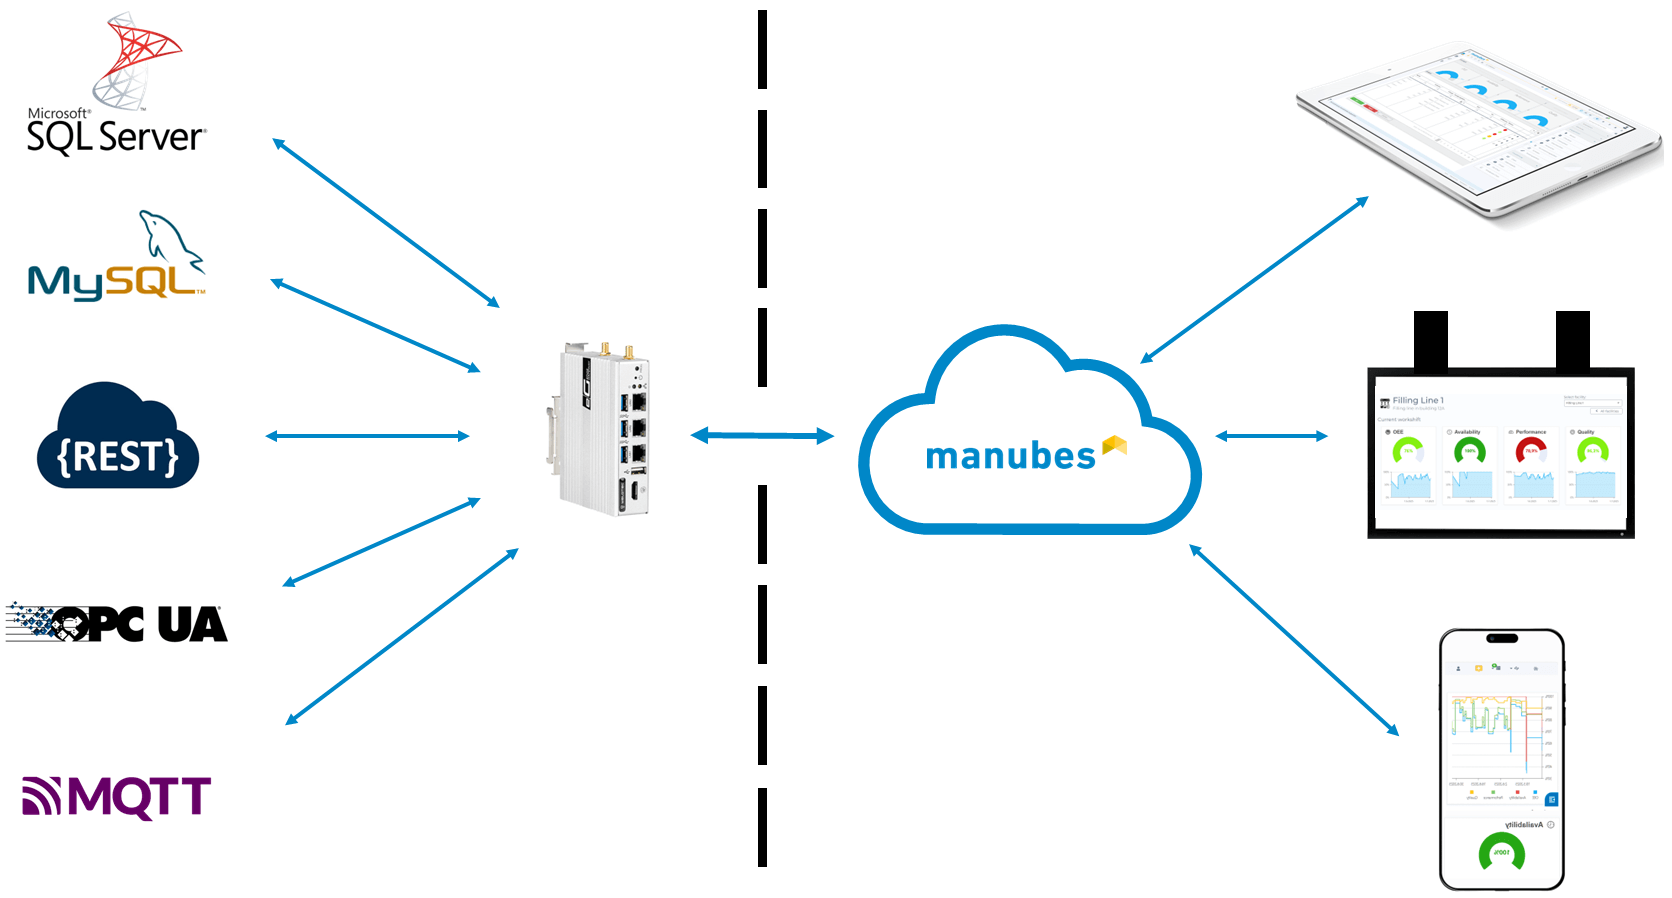
A dashboard is only as good as its data foundation. With manubes, you are able to collect production data from a wide variety of sources on a central platform. manubes supports industrial standard interfaces for machines and devices, databases and software systems such as MES, ERP or LIMS.
Proof of Concept –
Your individual project with manubes
We support you in creating your own dashboards with manubes. As part of a proof of concept, you’ll have the opportunity to try manubes in practice and implement your desired application in close collaboration with our team.
Examples
The right dashboard for every situation
Create suitable dashboards for different areas of your production and support teams with the right data at the right time.
OEE Dashboard
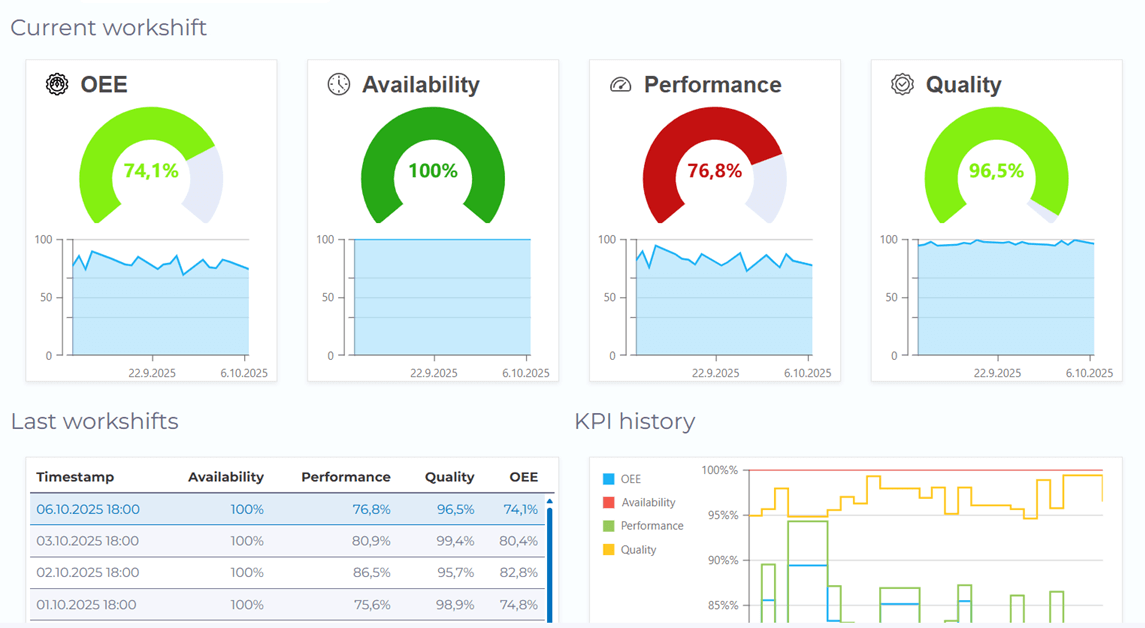
Overall Equipment Effectiveness (OEE) is one of the most important key metrics in production. An OEE dashboard provides insights into the performance of individual machines, production lines, or sites. With a built-in dropdown navigation, you can switch between machines to compare values and quickly identify anomalies.
Equipment Dashboard
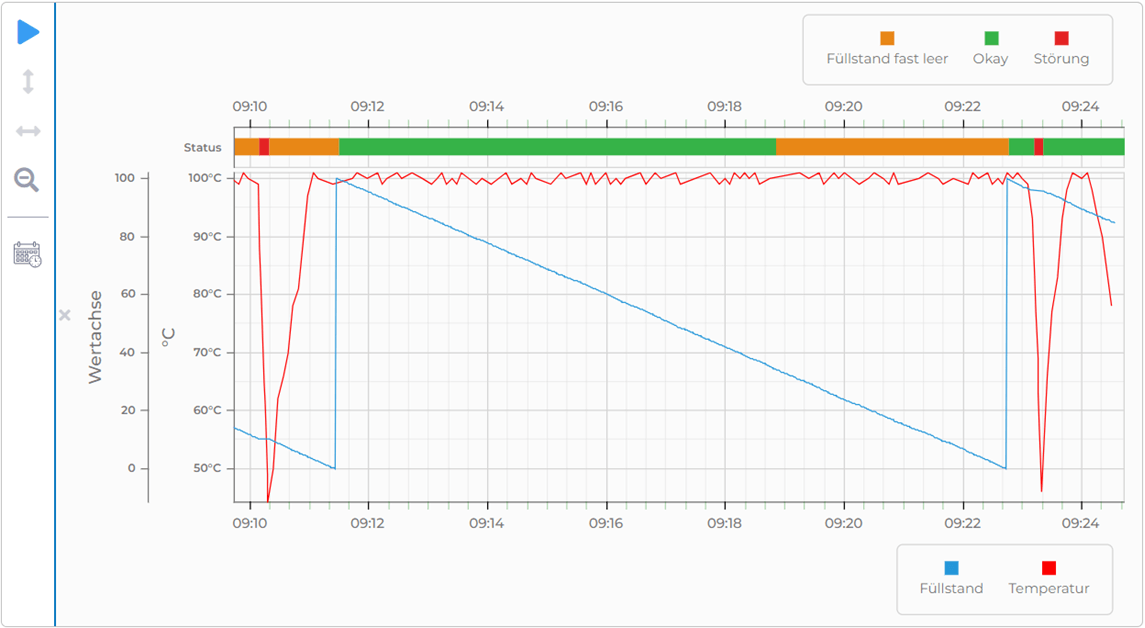
Monitor the status of critical production equipment using detailed overview pages. In addition to status indicators, selected process parameters can be visualized using appropriate charts, making anomalies immediately visible. Combined with custom alerts, this enables the fastest possible response to issues.
OEE Dashboard
Overall Equipment Effectiveness (OEE) is one of the most important key metrics in production. An OEE dashboard provides insights into the performance of individual machines, production lines, or sites. With a built-in dropdown navigation, you can switch between machines to compare values and quickly identify anomalies.
Equipment Dashboard
Monitor the status of critical production equipment using detailed overview pages. In addition to status indicators, selected process parameters can be visualized using appropriate charts, making anomalies immediately visible. Combined with custom alerts, this enables the fastest possible response to issues.
Daily Operations Dashboard
Gain a quick overview of the current production status. A general overview dashboard can include information such as production performance and order progress. Summaries of downtimes and selected key metrics also provide immediate transparency. If needed, users can be given access to more detailed views.
Order Progress Dashboard
Visualize the status of orders and gain a quick overview of the current order situation. Instantly identify delays, bottlenecks or deviations and take appropriate action. Information such as target vs. actual comparisons, machine utilization and performance metrics ensures maximum transparency.
Production optimization with custom applications
Where else can production data be used?
Effective dashboards are a key tool for monitoring and optimizing production. In practice, they can be complemented by additional applications that provide even greater transparency.
Reporting
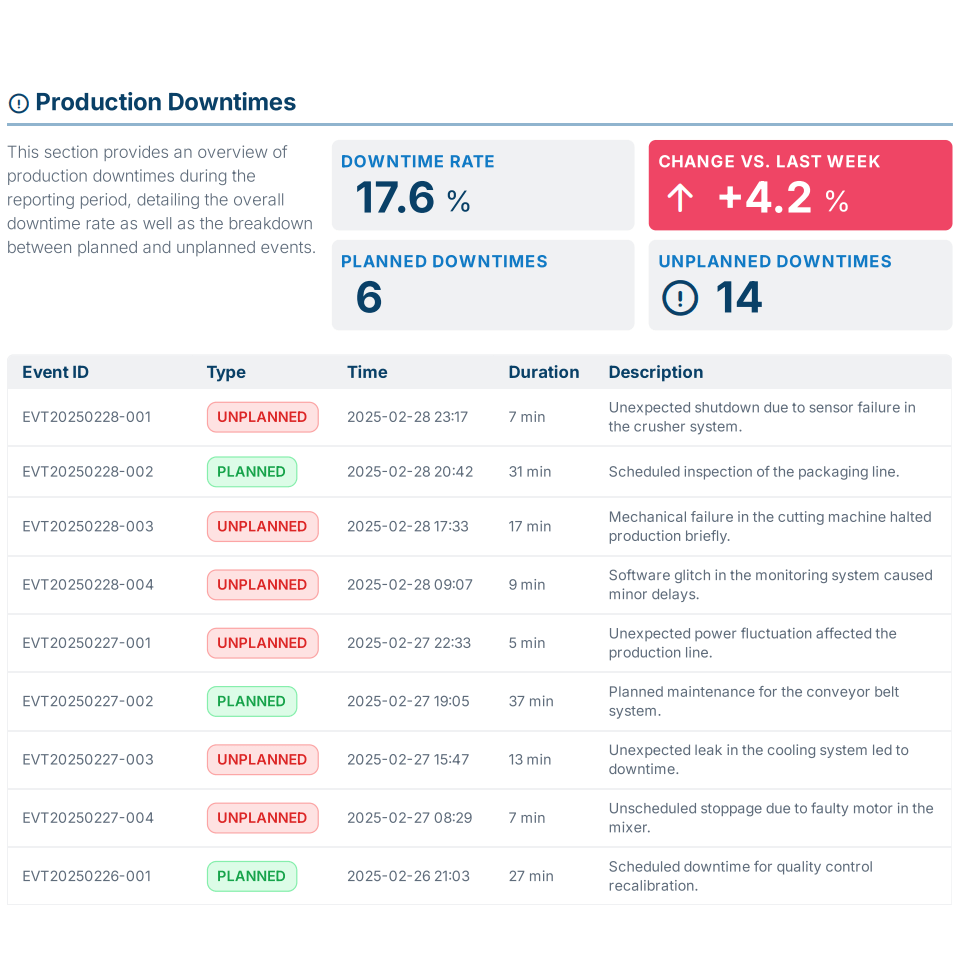
Production reports provide an overview of progress, key metrics and events on the shop floor – often with a higher level of detail. manubes offers reporting tools that enable the automated creation of dynamic reports. By linking your own report templates to real-time data sources, the information they contain remains consistently up to date.
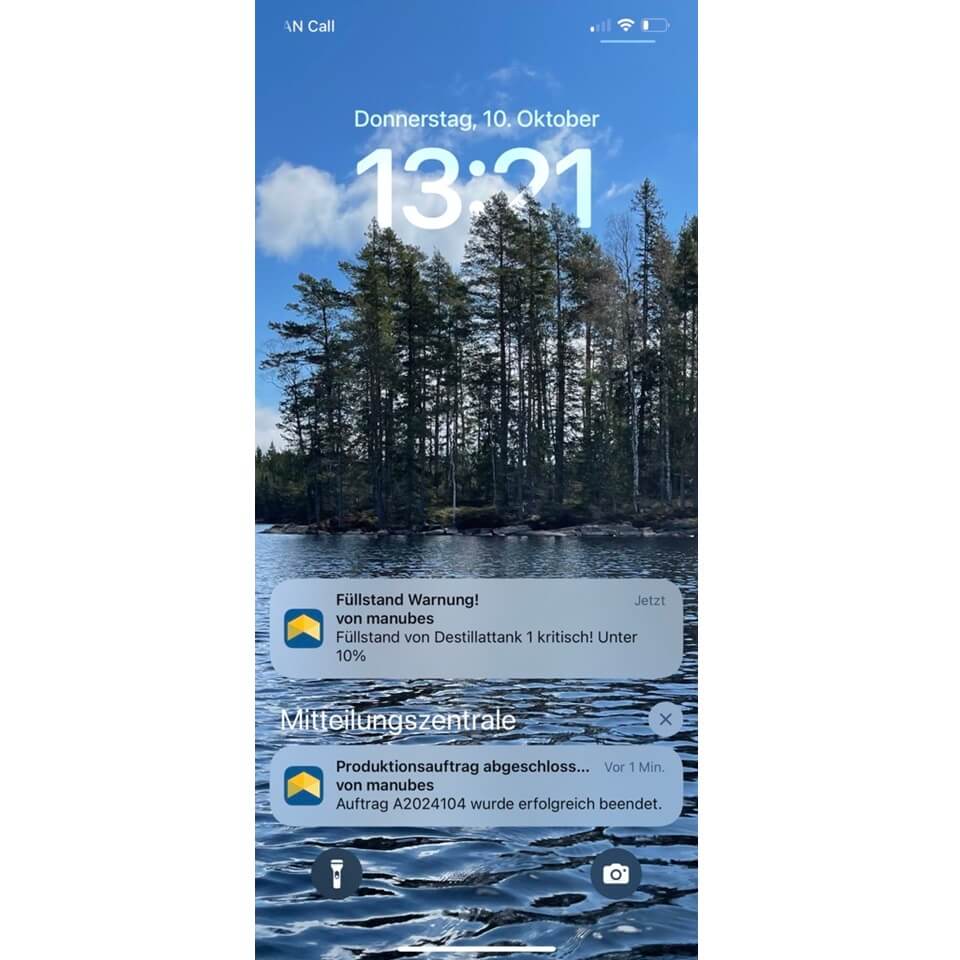
Push Notifications
Mobile push notifications ensure that responsible personnel are immediately informed of specific events such as downtimes, maintenance needs or threshold violations in process parameters. With manubes, you can configure custom alerts and notifications for any device.
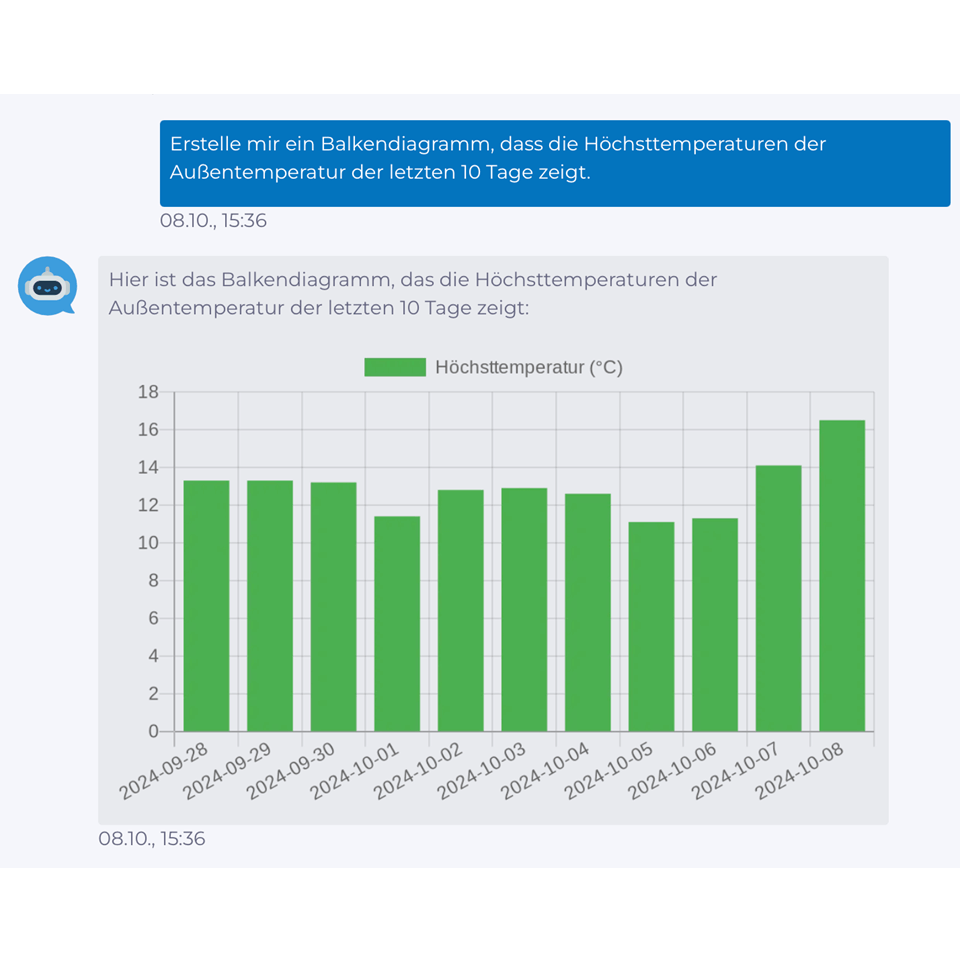
AI-assisted data processing
Artificial intelligence offers new possibilities for working with production data – especially when dealing with large and complex datasets. The AI-powered manubes chat assistant delivers visually prepared insights from existing data within seconds. This not only enhances transparency but also significantly reduces the time required for data analysis.
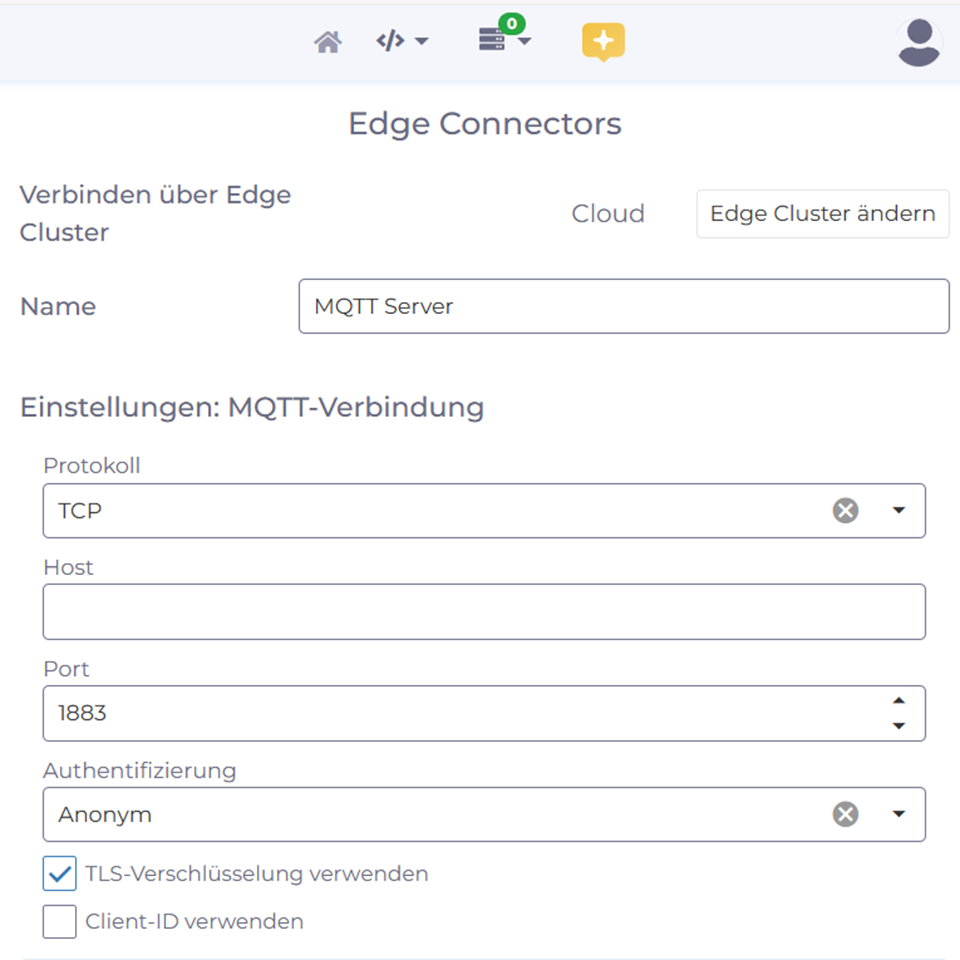
Data integration for advanced analytics
Transfer data to other systems via API integration or connect manubes to broker-based data exchange using MQTT. Unlock your production data for advanced analysis through AI systems and algorithms, including anomaly detection and time series forecasting. manubes provides easily configurable clients for both MQTT and REST communication.
Try manubes for free
Get started with manubes in your personal cloud environment.
